Chart of the Day: Meta Pulls Back Just in Time
Let's look at the setup for this Mag 7 name ahead of earnings next week.
You've reached your free article limit
You've read 0 of 1 free Pro articles.
There is no better setup before earnings than a modest pullback on lower volume to scare the crowd into selling their shares. Some may interpret the Meta Platforms META chart as a topping pattern, but that really does not square with us. Frankly, a modest pullback before next week's Q2 report may be just what the doctor ordered.
The stock is right near all-time highs which it exceeded at the end of June. Since then Meta is down about 8% but on weaker turnover, telling us the big institutional money is not yet selling the stock. That is bullish.
The trend in Meta is undeniably bullish, certainly since that bottom formed in early April, which was actually a double bottom. Higher highs, higher lows is our textbook definition of an uptrend, and candles are blue or teal (bullish) on the GoNoGo composite of indicators, reflecting strong bullish price action.
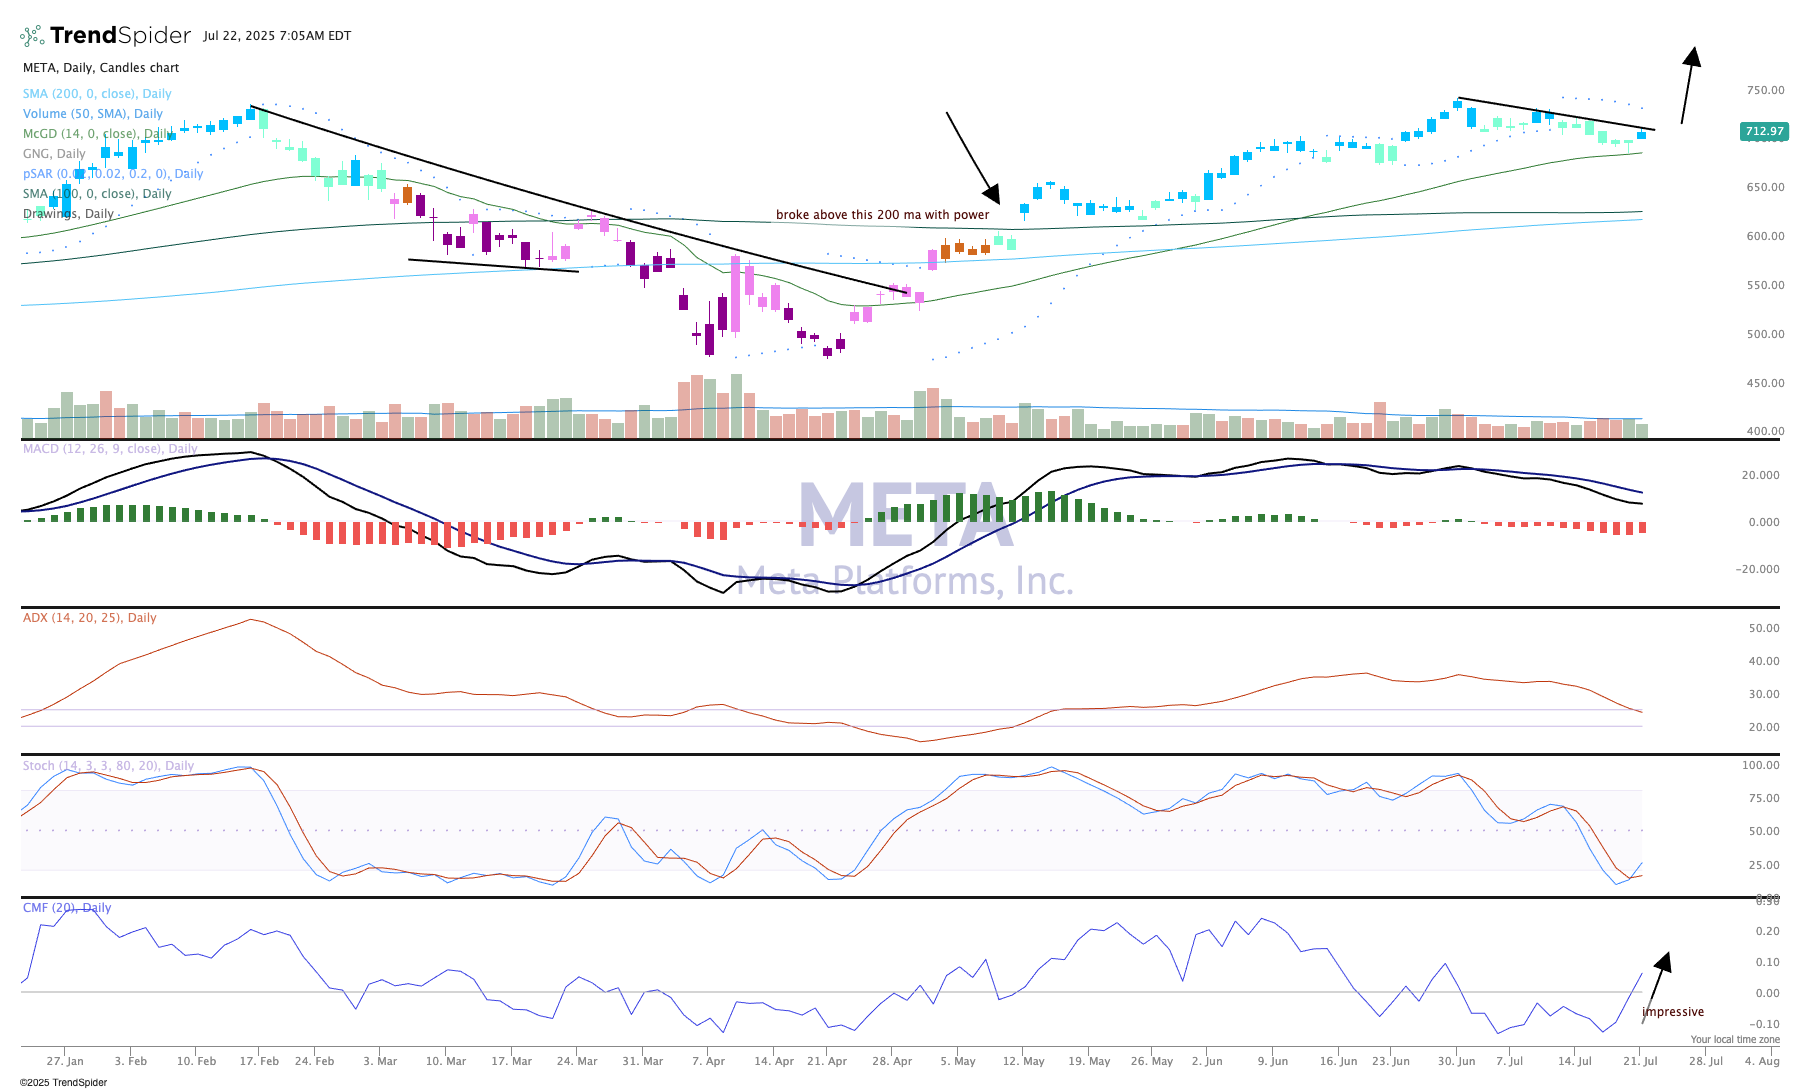
As the recent pullback took shape, momentum started to slow as did direction (pane 3 and 4), but look at the change in money flow (bottom) — this is a positive divergence that is telling us big money is scooping up Meta on this pullback. Earnings next week will be a catalyst for a move.
We like Meta in TheStreet Pro Portfolio and rate it a Two, or "stockpile on pullbacks."
At the time of publication, TheStreet Pro Portfolio was long META.
