Chart of the Day: Meta Could Bounce on Earnings But Will Volume Remain an Obstacle?
If the market's response is bullish, look for a quick move to the 200-day moving average and then ... a decision point.
You've reached your free article limit
You've read 0 of 1 free Pro articles.
No question the chart of Meta Platforms META shows bearish characteristics, but we can make an argument that a bottom is in the works. The candles in the chart are still purple from pink, as you can see on the top pane. This reflects at least a cautious tone on the GoNoGo composite of indicators. The downtrend line drawn from the highs is in place, but recent attempts to rally above that line were on poor volume, which means those attempts were feeble. If we can mount a nice price move on good turnover, then that move would have staying power.
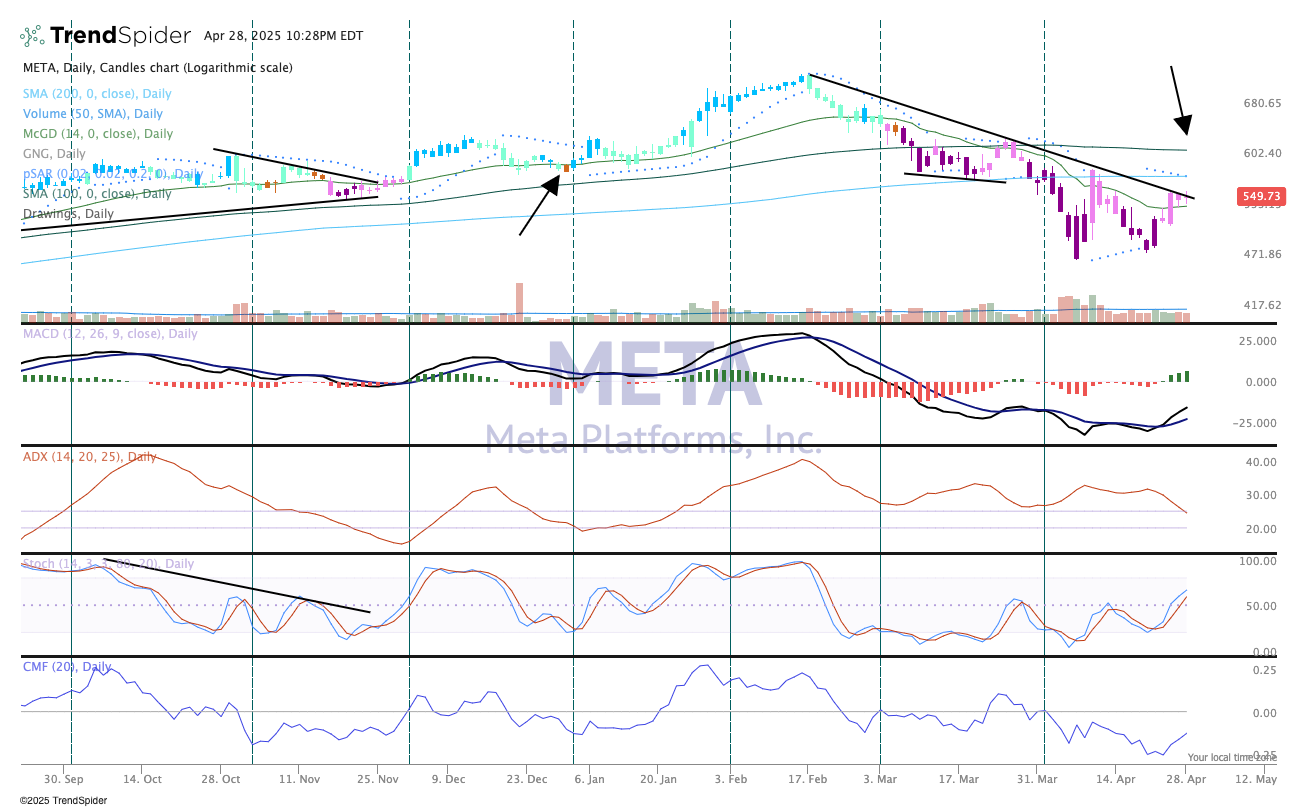
Notice the indicators below are mixed, with a bullish signal from Moving Average Convergence Divergence indicator, in the second pane, and stochastics, in the second-to-bottom pane, but money flow remains bearish. Money flow, however, as we see in the bottom pane, is actually trying to turn.
The company will report earnings tomorrow, Wednesday, after the close as the market holds it breath for a report that won't shatter new-found confidence. Meta has recently delivered strong gains and that could again be the case. If the market's response is bullish, look for a quick move to the 200-day moving average (arrow) and then a decision point.
We like Meta in TheStreetPro portfolio and rate it a "Two," or stockpile on pullbacks.
The Pro Portfolio is long META.
