Chart of the Day: Marvell's Chart Is Cryptic Ahead of Earnings
Marvell reports this week but the stock is rangebound, so let's check the technicals and compare with the last report's reaction.
You've reached your free article limit
You've read 0 of 1 free Pro articles.
Nothing positive has been happening for Marvell (MRVL) since that last earnings report when the stock jumped higher on big volume. That was three months ago and of course there has been a down move in the chip sector. Sellers hit the stock hard after the start of the year and have been pushing it down below support. The stock is now well below key moving averages, which are now set up and resistance levels.
The moving average convergence divergence, in the second pane, is below zero but has crossed over bullish, yet we can clearly see this indicator not helping the stock advance. The Chaikin money flow has improved though, stochastics are just flat meaning there is no momentum in the stock. Lastly, the chart shows pink/purple candles, this is a bearish reading on the GoNoGo composite of indicators at the top of the chart.
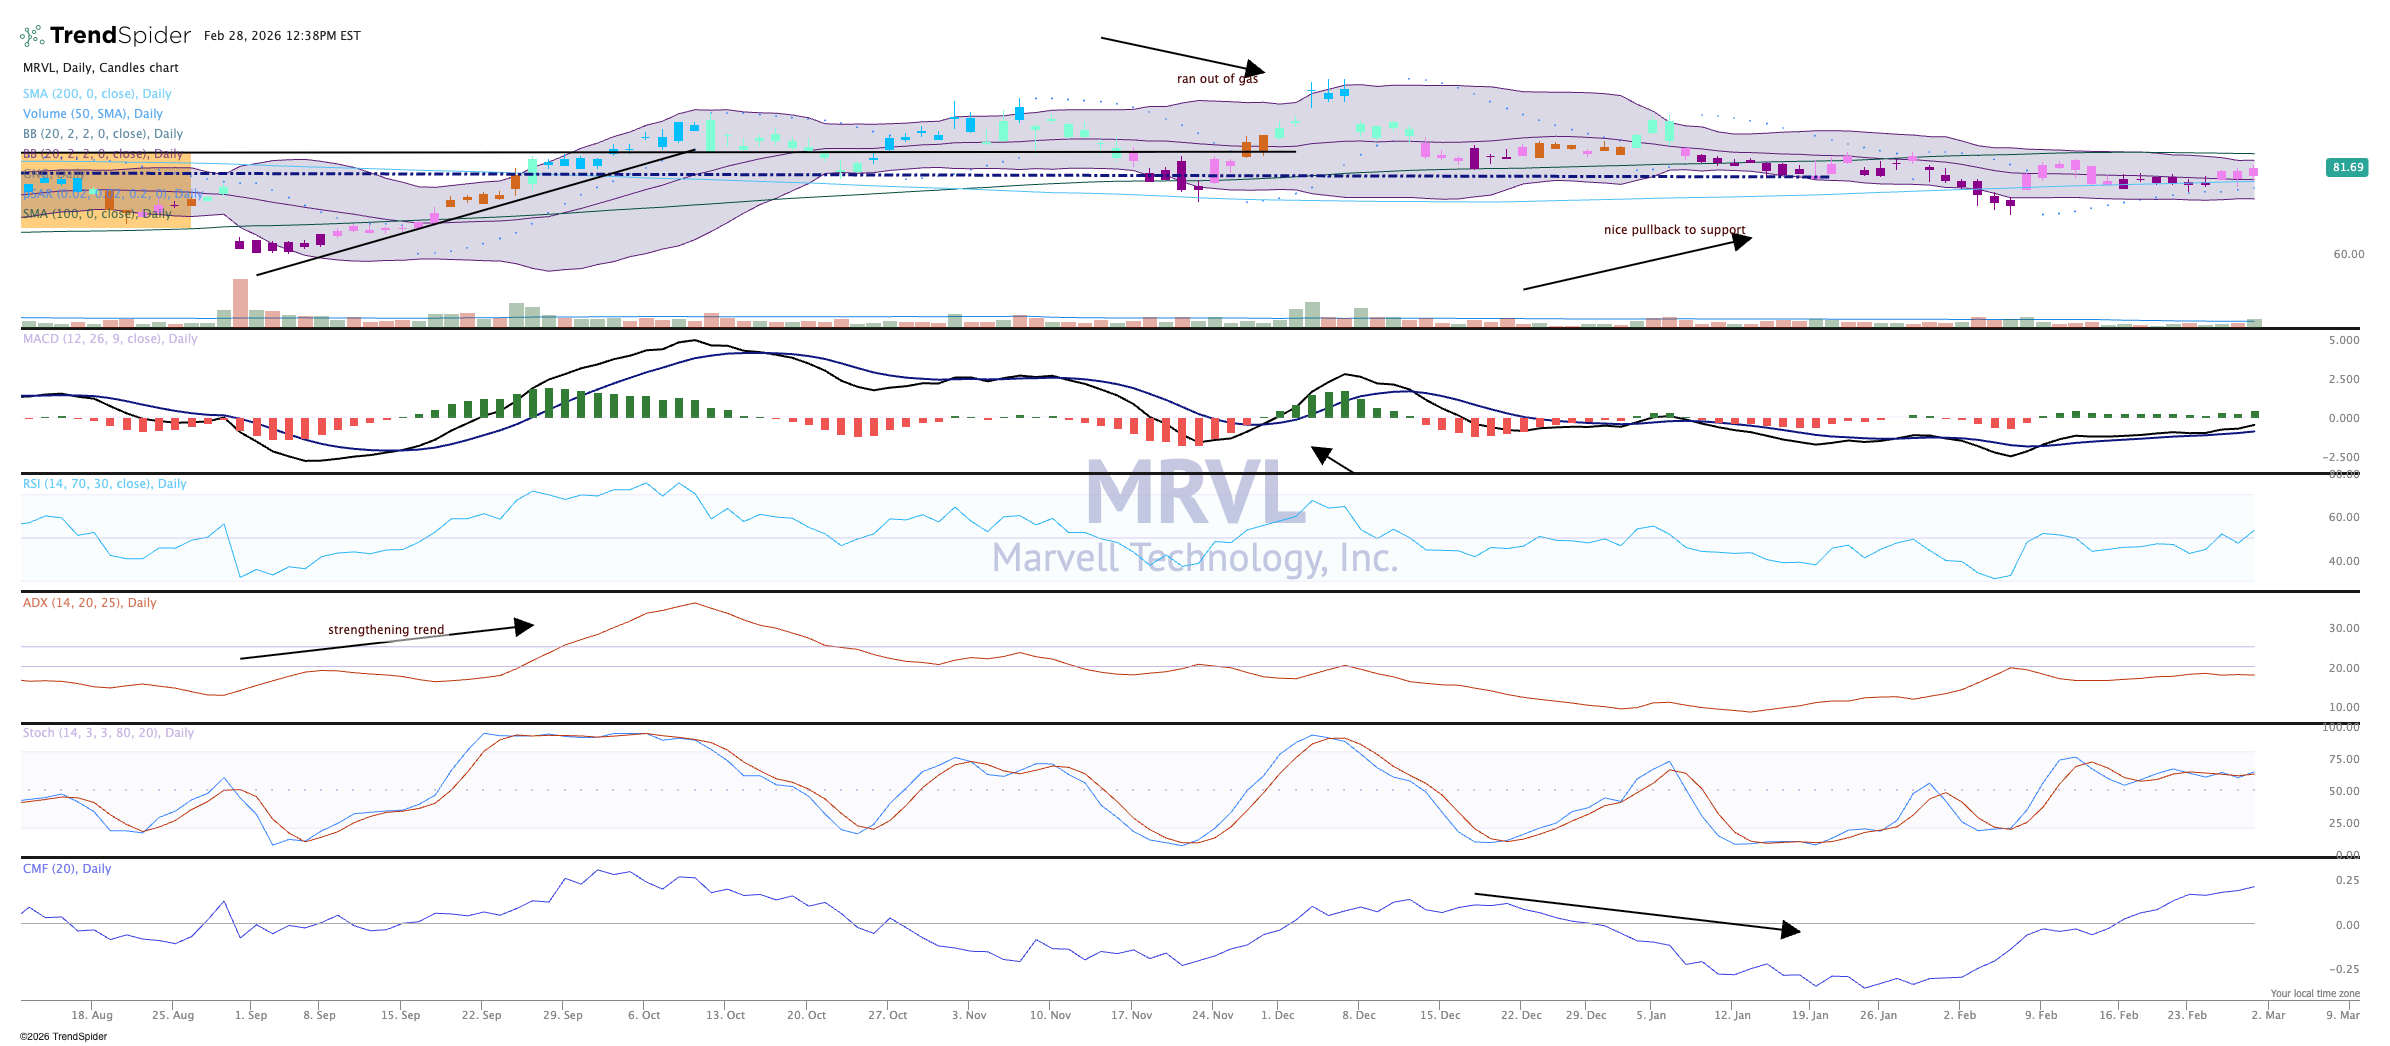
Now, the last time Marvell reported that same condition existed, it only took a few strong days to change the sentiment from bearish to bullish. But as we see the top Bollinger band caused the stock to "run out of gas" (arrow), as sellers soon took control. Maybe we see this same response later in the week, earnings out after the close on March 5.
We like Marvell in TheStreetPro Portfolio and rate it a One, or "buy at anytime."
MRVL is a holding in the Pro Portfolio.
