Chart of the Day: Lost in the Meta-verse
The stock of Meta Platforms has come back to support but is breaking some strong levels as it looks for buyers below.
You've reached your free article limit
You've read 0 of 1 free Pro articles.
Meta Platforms META is one of those Magnificent 7 stocks that has fallen out of favor. It doesn't take much to change these behemoths from bullish to bearish. The heavy volume and weak price action gives us pause as we find out soon where buyers are located. The dip buyers had been pretty active in buying this stock up over the past few months, taking advantage of price moves down to important support levels.
But lately that trend has not been popular. In fact, we've seen a series of lower-highs, lower-lows and a recent close below the 14-day McGinley Index (arrow in the top pane of the chart). Now, we do see this as a short-term support area, but we did see the price color change to amber in the top pane, which is neutral on the GoNoGo composite of indicators.
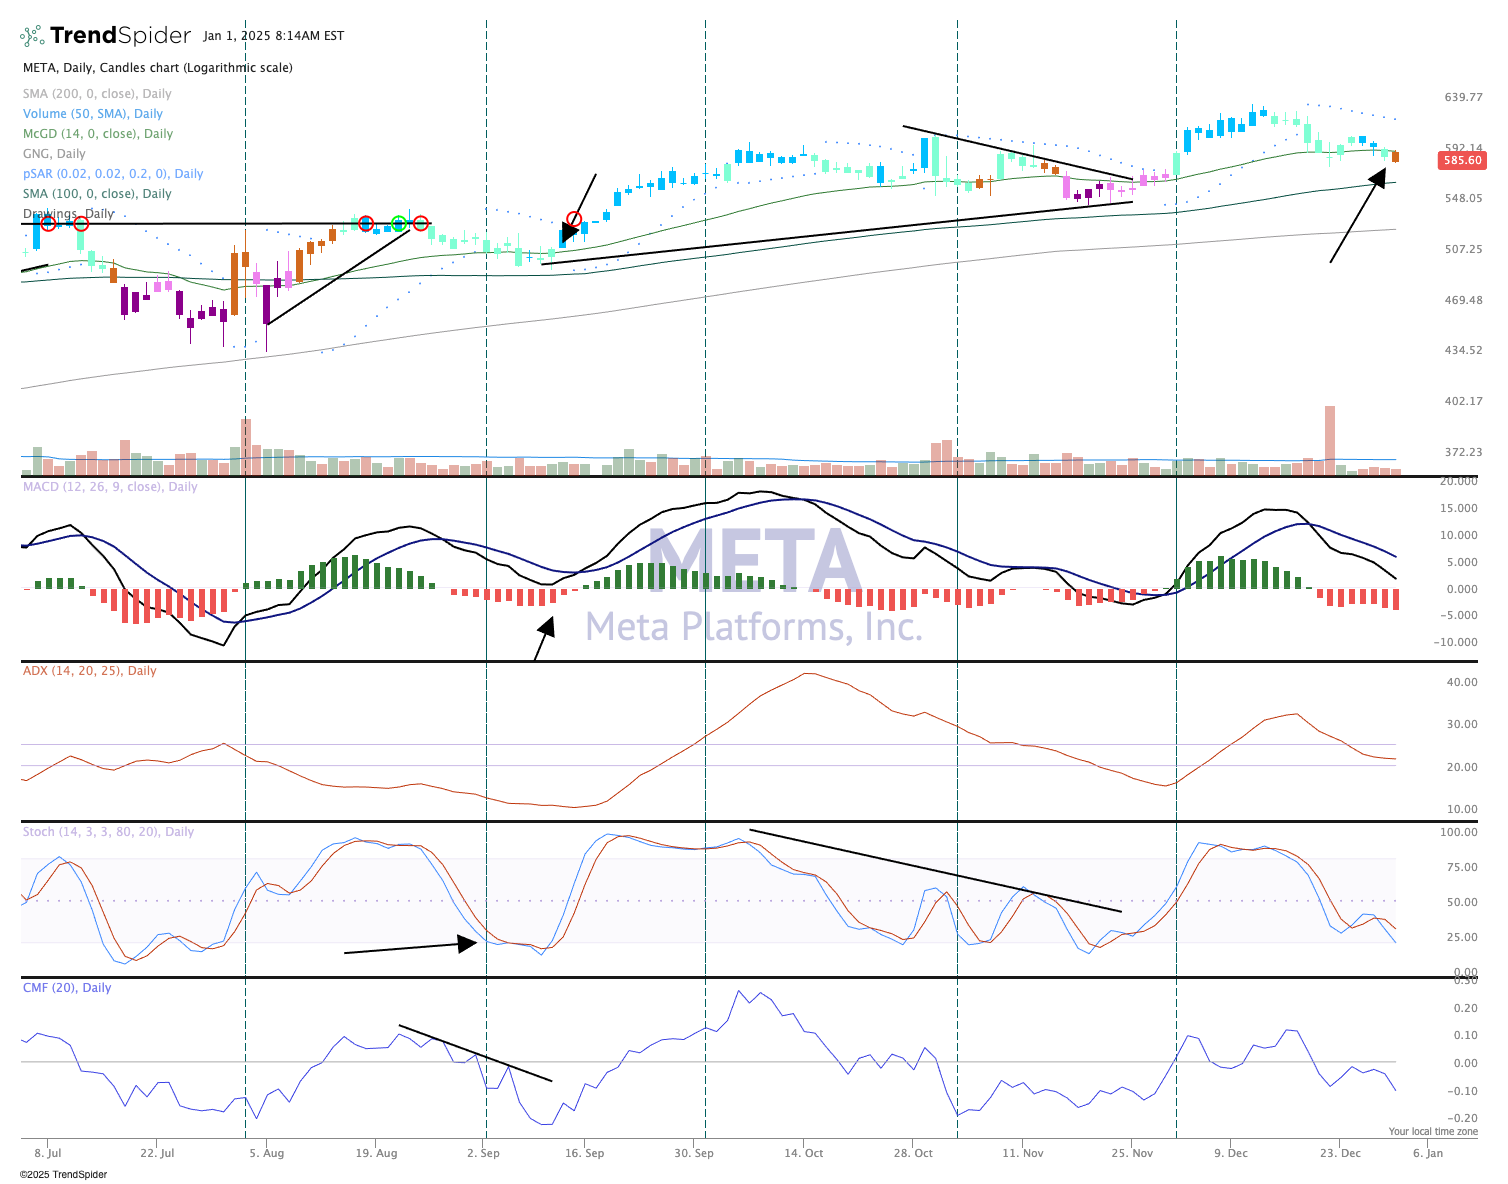
The Moving Average Convergence Divergence indicator, as seen in the second pane, is already on a sell signal. The stochastics (momentum), in the second-to-bottom pane, are oversold.
We might say the stock is due for a bounce, but where it comes from is anyone's guess. The stock is in a no-man's land. Perhaps a bit lower to the 100-day moving average (shown at top pane) would do the trick, or simply some sideways action as the bulls regain their footing.
We like Meta Platforms in the TheStreet Pro Portfolio and rate it a two, or stockpile on pullbacks.
The Pro Portfolio is long META.
