Chart of the Day: Keep a Close Eye on Bank of America as Earnings Land
The chart is still looking strong, but we're getting some mixed signals as we await tomorrow's report.
You've reached your free article limit
You've read 0 of 1 free Pro articles.
With earnings out Wednesday for Bank of America (BAC) , the risk is high for the bank after such a strong move up. Higher-highs, higher-lows is our trademark uptrend pattern. Since the April lows that pattern has been what we have seen from the stock.
Yet, looking at the indicators below the price chart, it appears they are turning down or have already done so. Of course, the price chart remains bullish, so we give BAC the benefit of the doubt for now. Dips are to be bought.
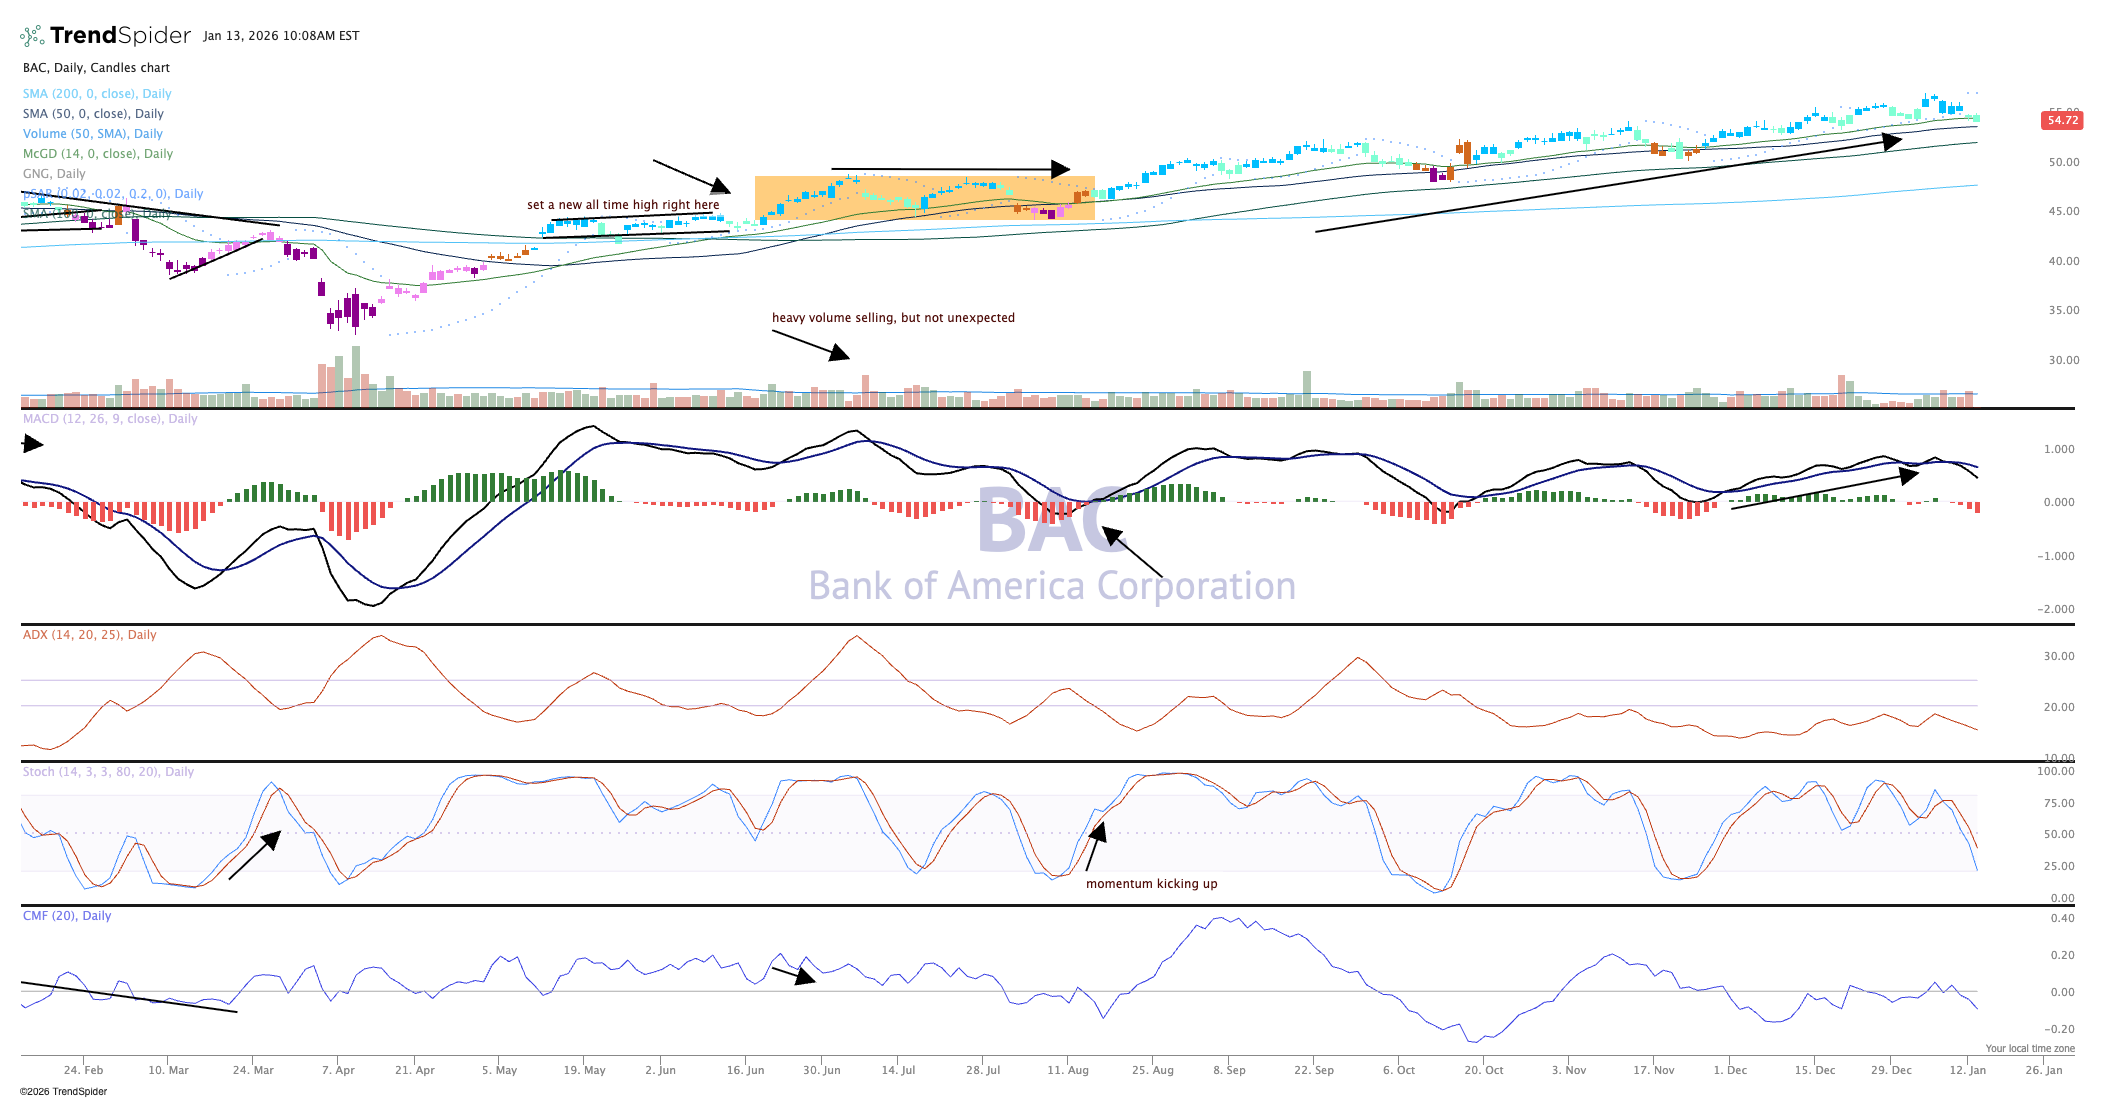
Money flow, as seen at the bottom of the chart, is bearish again, momentum has turned down with weaker stochastics while the moving average convergence divergence, as seen in the second pane, is on a sell signal. Again, these are supporting indicators for which we don't move upon, but need to watch carefully for a change in tone.
Earnings are slated to land before the open Wednesday. We like Bank of America in TheStreet Pro Portfolio and rate it at two, stockpile on pullbacks.
The Pro Portfolio is long BAC.
