Chart of the Day: Google's Recent Touch of This Spot May Be Important
The stock has corrected significantly and now perhaps a basing period is due.
You've reached your free article limit
You've read 0 of 1 free Pro articles.
It's been kind of a rough year so far for Alphabet (GOOGL) , which seemed to have done nothing wrong but rise up and hit new all-time highs. For a time, this was the worst-performing Magnificent Seven name, but a ferocious rally since last fall lifted the stock to a $4 trillion valuation, second only to Nvidia (NVDA) , before recent declines.
Pressure was building on GOOGL the last month or so, as the chart shows lower highs, lower lows and a sell signal on the MACD (moving average convergence divergence). A recent touch of the 100-day moving average may prove to be the spot where the stock bottoms, but we'll have to wait and see if it holds. Below there, of course, is the 200-day moving average, but that is quite a fall from current levels (to around $245).
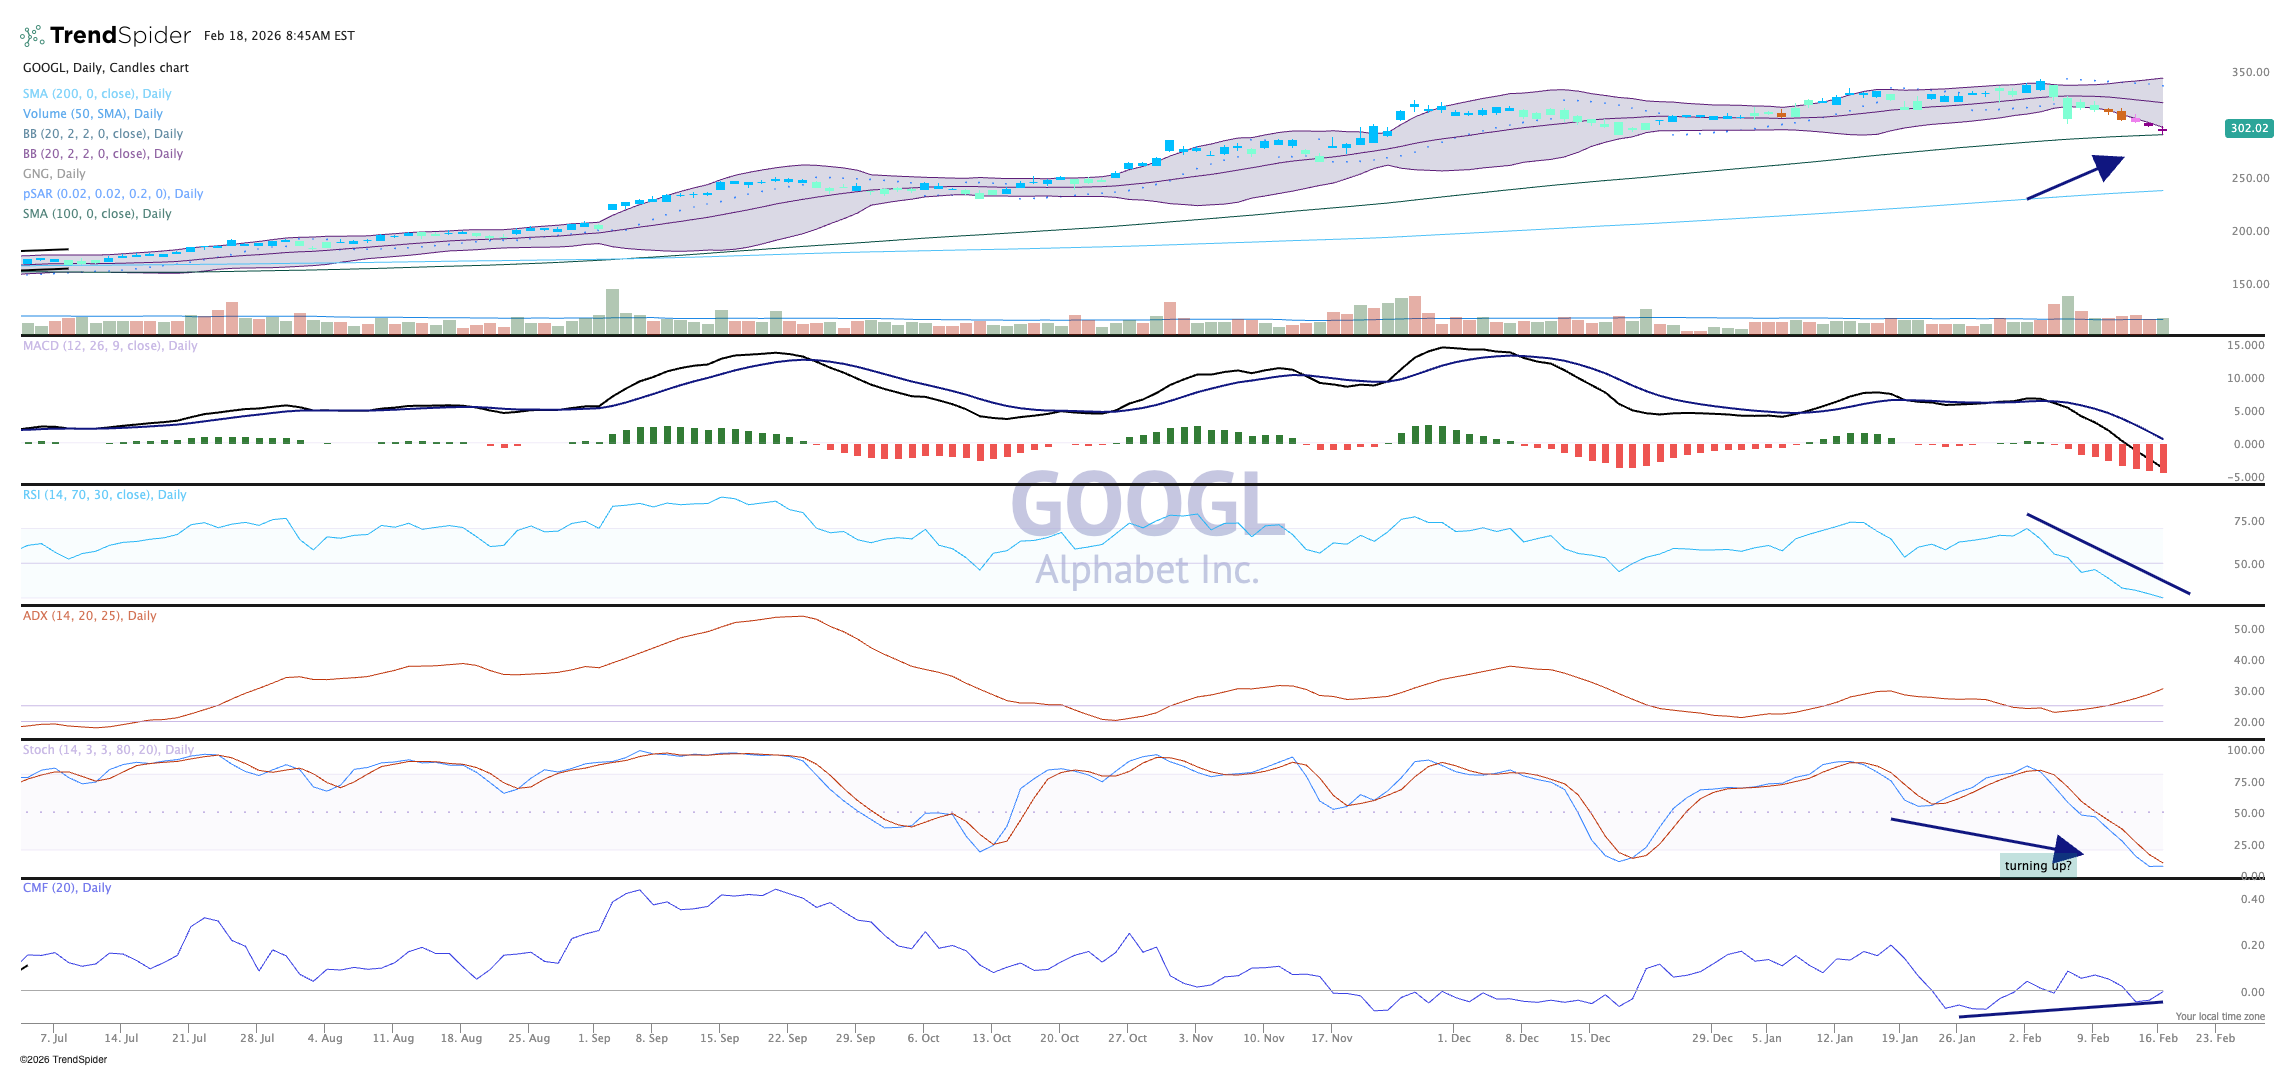
With the next earnings release coming towards the end of April there is not much risk in holding or adding GOOGL shares. Money flows have been weaker since mid-January but this indicator (CMF, bottom pane) may have already bottomed out. Yet, the price chart is bearish, with purple candles, so we need to respect the price action.
GOOGL is bearish until further notice, but at good support. If the stock can gain some traction and simply move sideways for a bit, there is a chance it can rise up again. That sideways action would be a good spot to add more shares if you are light.
More Pro Portfolio:
- We're Ringing the Register on a Holding That's Gone Parabolic
- We're Eyeing 20 Signals Across 7 Pro Portfolio Investing Themes
- Weekly Roundup: As VIX Spikes, Are 2 Stocks Quietly Signaling a Bottom?
At the time of publication, TheStreet Pro Portfolio was long GOOGL and NVDA.
