Chart of the Day: From Rangebound to Big Move?
This stock is bouncing around in a wide range but that could ultimately mean something more positive is imminent.
You've reached your free article limit
You've read 0 of 1 free Pro articles.
Elastic ESTC has not given us much to be excited about. Since Elastic posted those robust earnings in November and seeing the shares shoot higher, ESTC has settled back down into a range. That is fine for a while, in fact the longer the base the higher the space (Louise Yamada!). Indeed, given that large move Elastic had, it makes sense for the stock to base for awhile, and even better that Elastic is building a base in the higher end of the range.
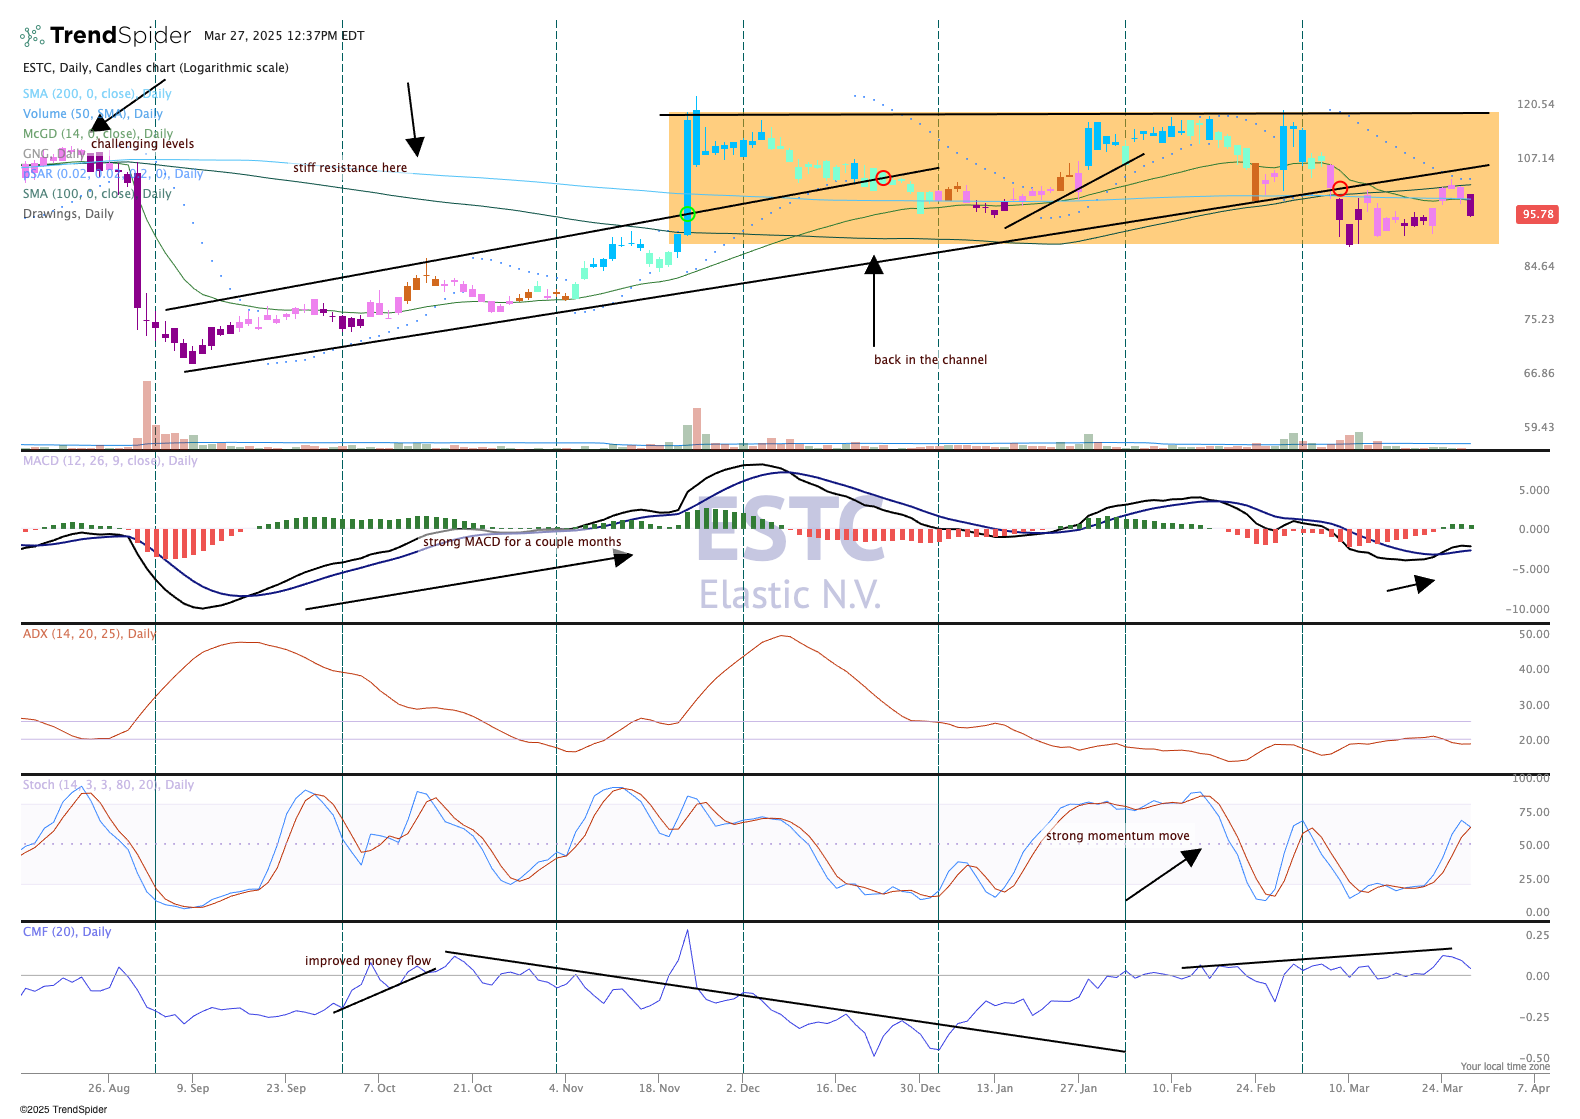
While we wait for what may come next we have clues to the direction by looking at the indicators. MACD (moving average convergence/divergence) has been struggling, but is in a bullish crossover, and momentum is good with stochastics pointing in the right direction, but it may have stalled. Money flow remains positive.
The problem is the price chart, which is pink/purple and reflects bearish qualities on the GoNoGo composite of indicators. Further, the parabolic SAR (stop and reverse) is also bearish (dots in the top pane).
We can afford to wait with this name. It can bounce around while we wait and look for spots to add shares.
We like Elastic and rate it a One in TheStreet Pro Portfolio, or "buy at anytime."
At the time of publication, TheStreet Pro Portfolio was long ESTC.
