Chart of the Day: For Qualcomm, Follow the Money Flow
The stock was doing well recently but a sharp pullback threw it back to support. Let's see where it could go next.
You've reached your free article limit
You've read 0 of 1 free Pro articles.
Qualcomm (QCOM) had been on a strong run since the summer, but recent selling has brought the stock down hard.
Fortunately for investors, the moving average support has held up so far, but the indicators are not looking all that bullish. The Moving Average Convergence Divergence, as seen in the second pane, continues to be on a sell signal.
Money flow, as seen in the bottom pane, just went bearish. But this indicator may re-establish itself above the zero-line, where it tends to hover this time of year (indicating big money manager flows are accumulating).
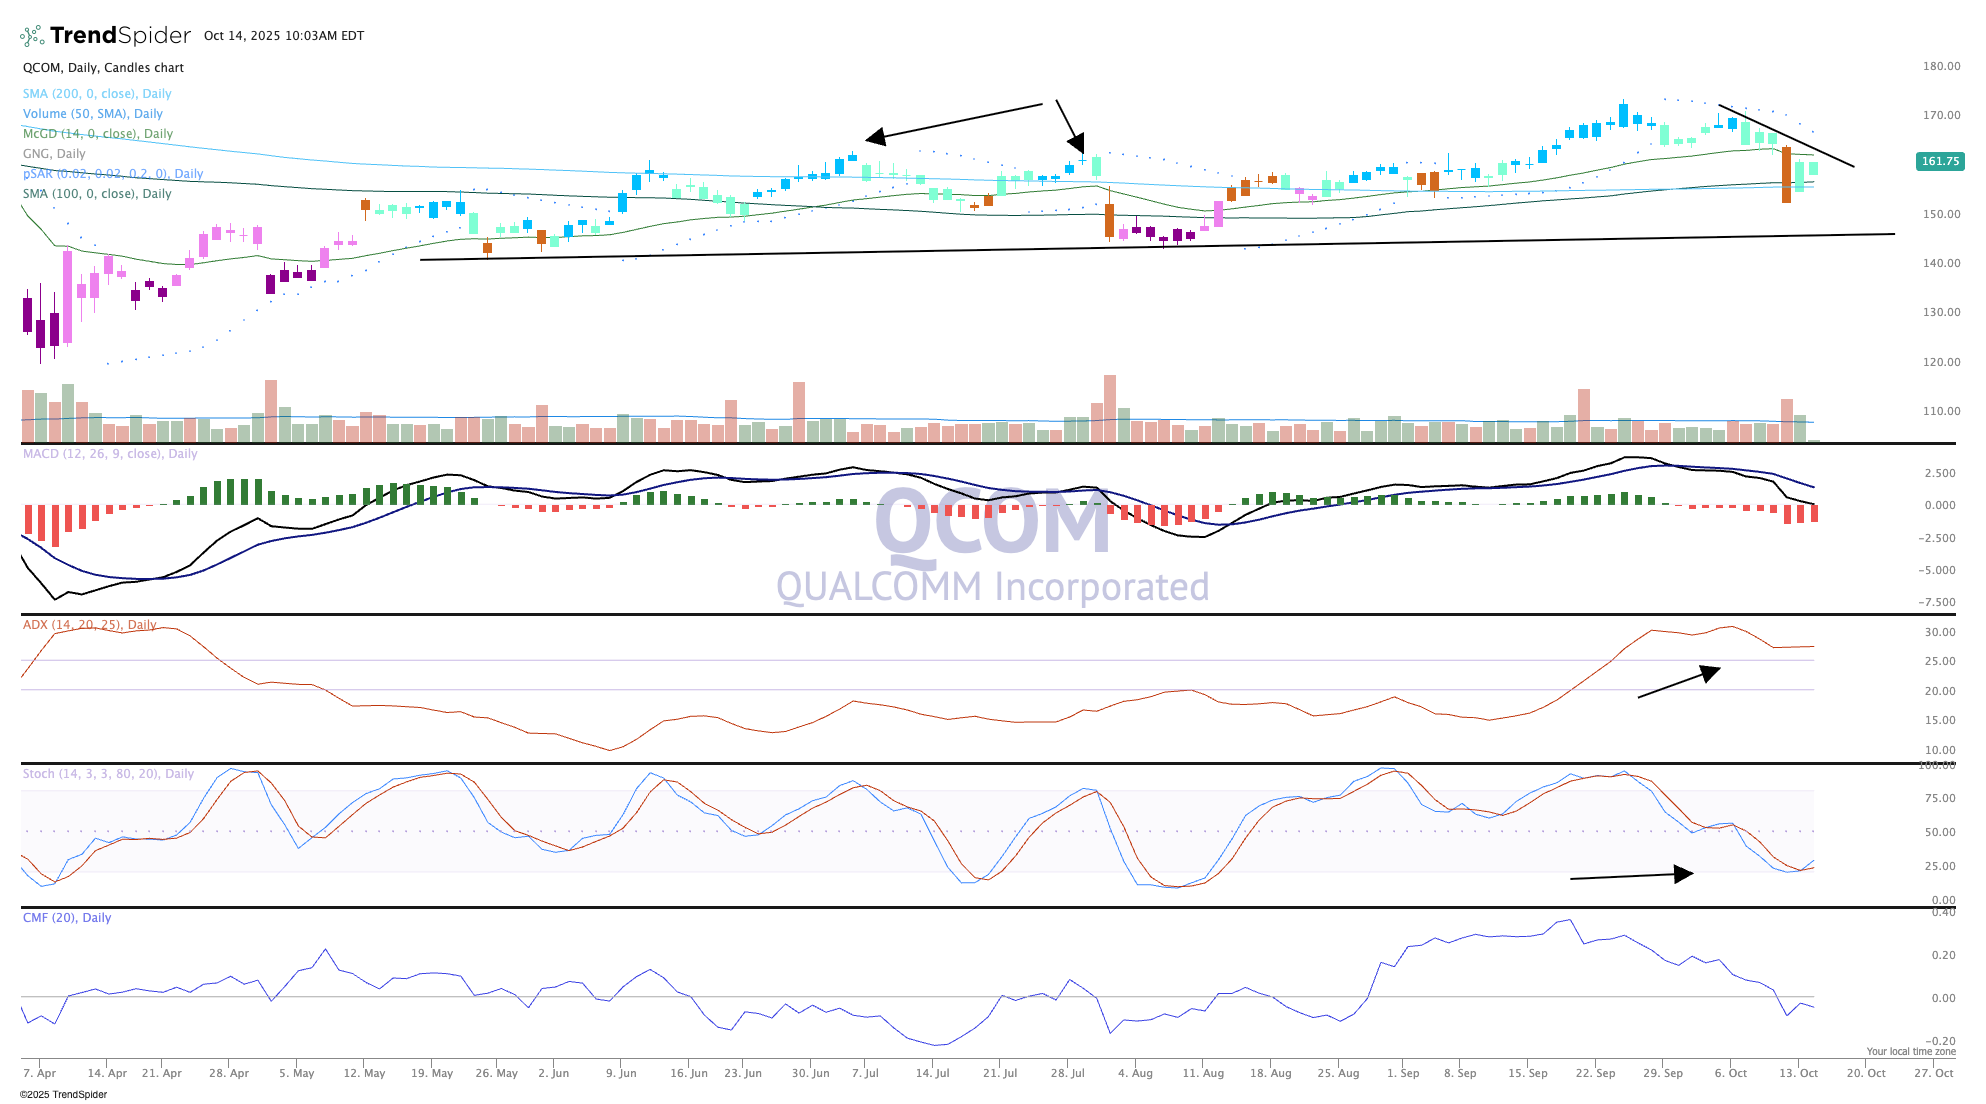
After a nice bullish run, the chart now shows neutral, which could move down to bearish with a few more sessions lower. We do see a few green shoots, with stochastics, in the second to bottom pane, starting to turn upward. That is our main momentum indicator, and if we get some upside follow-through that should work to get the stock moving higher.
No question Qualcomm has been a laggard among the chip names, mostly related to AI. But we believe the future is now for the big Q, and the stock should follow upward.
We like Qualcomm in TheStreet Pro portfolio and rate it a one, or buy at anytime.
The Pro Portfolio is long Qualcomm.
