Chart of the Day: For Costco, Which of These 2 Scenarios Will Play Out?
The stock has been under distribution for six weeks and is looking for that elusive bottom.
You've reached your free article limit
You've read 0 of 1 free Pro articles.
The June monthly same-store sales numbers for Costco COST were notably strong this past week. The stock rose up smartly in after-hours trading, but backed off those highs during real time hours.
Does that make much sense?
From a technician's point of view it does, as the stock has been in a bearish tailspin for weeks. All of the indicators we look at are pointing bearish, but the most important of all — price action — is uber bearish.
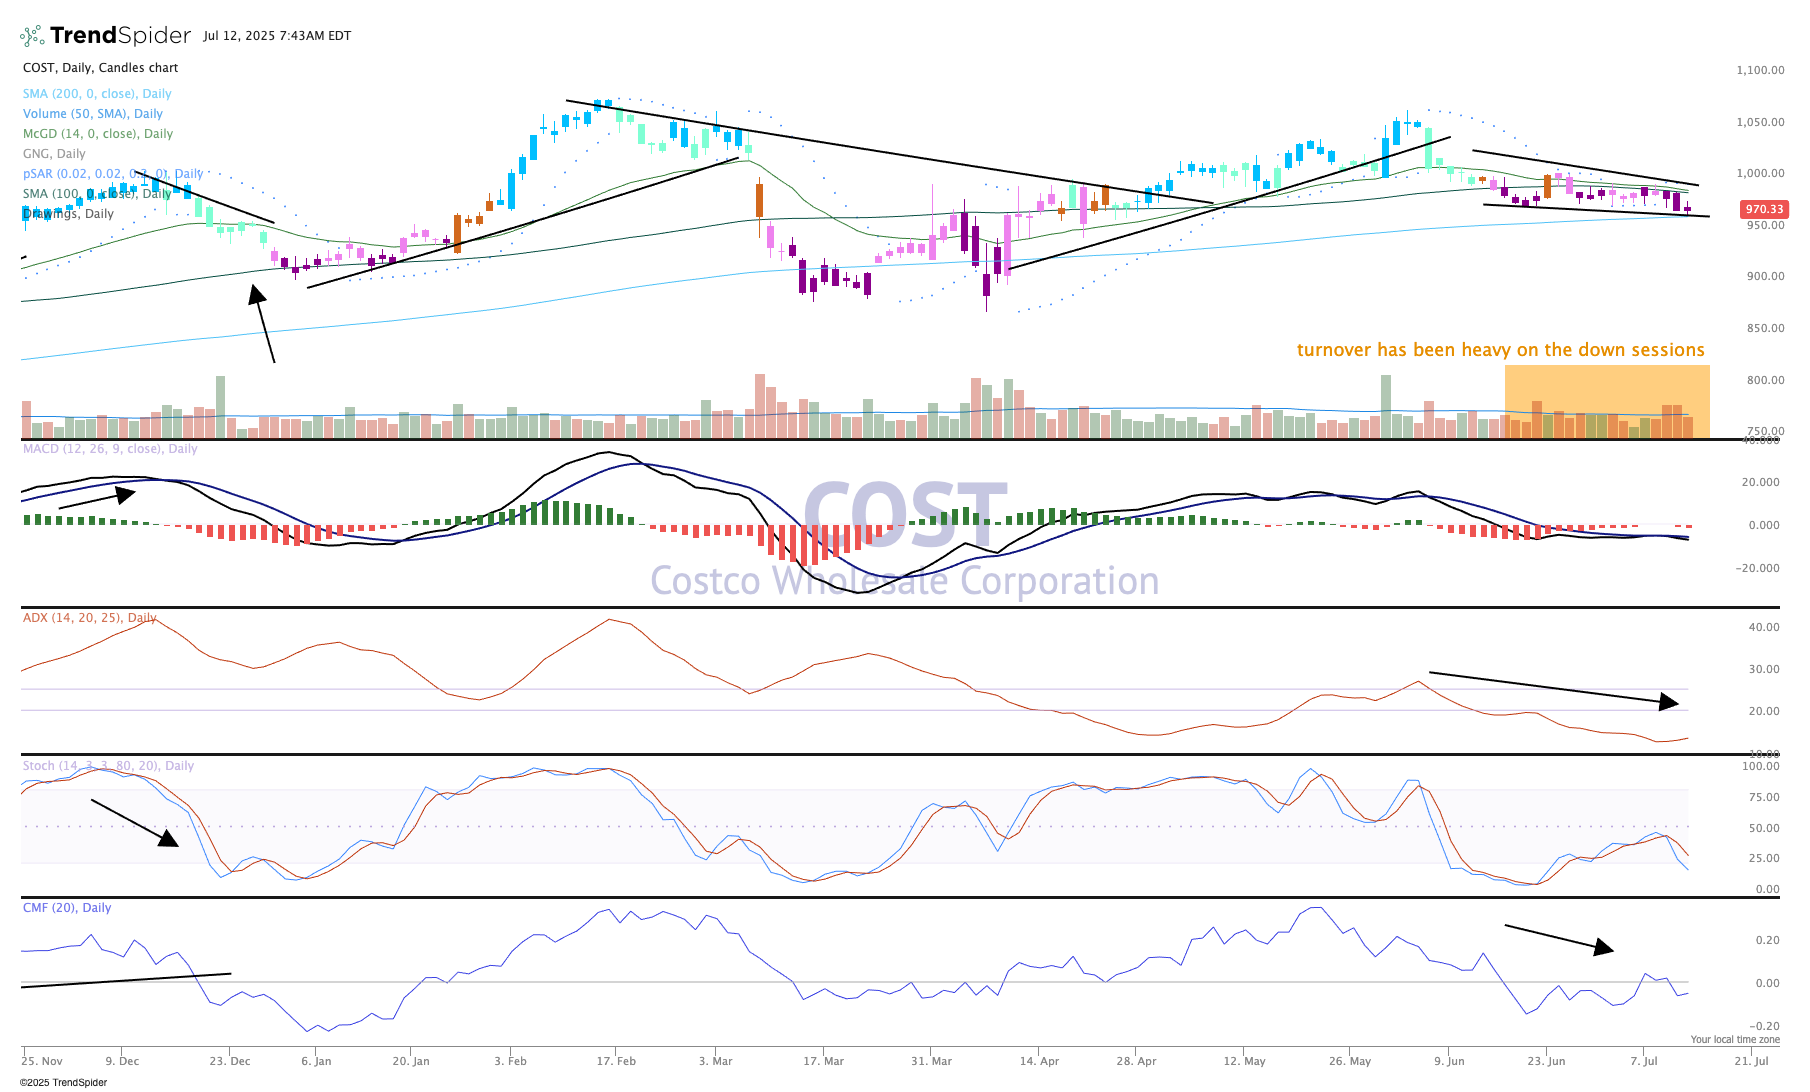
Now, that does not mean the shares should be sold, in fact, if we see that Costco can hold current levels of support at the 200-day moving average then we will know this level is firm and buyers can step in to add shares. The first test happened Friday, and now we'll have to see how the "big money" plays this one. Will it be lower prices toward the April lows at $900 or will dip buyers add shares?
It is useless to guess, so let's wait and see how it plays out over the next few weeks. We have our two scenarios laid out. There will be plenty of time to get on board if this stock turns bullish.
We like Costco in TheStreet Pro Portfolio and rate it a One, or "buy at anytime."
More Pro Portfolio:
- We're Locking in Big Gains on 2 Holdings and Buying More of Another on Weakness
- Weekly Roundup: Making Moves as Uncertainty Rises in a Complacent Market
- Stocks & Markets Podcast: Small Caps & Your Portfolio With Thomas Browne
At the time of publication, TheStreet Pro Portfolio was long COST.
