Chart of the Day: For Axon, It's Technicals Vs. Fundamentals
The heavy volume the last few days indicates investor distribution, as we eye this price.
You've reached your free article limit
You've read 0 of 1 free Pro articles.
It's been a rough six months for Axon Enterprise (AXON) as the stock fell hard following a big earnings beat last summer and continues to swoon. I had thought the $500 level would hold firm lately, but news about adding more cameras in Minnesota and other states via more spending from Homeland Security might be positive for Axon. Nevertheless, the $500 level is important and defines a break from bearish to bullish. There is nothing set in stone on this decision, but investors in the stock are not waiting it out.
The chart is bearish, candles at the top are purple here, and while it seems to be oversold the stock has not bottomed yet. The break below $519 was sharp. It was met with heavy selling.
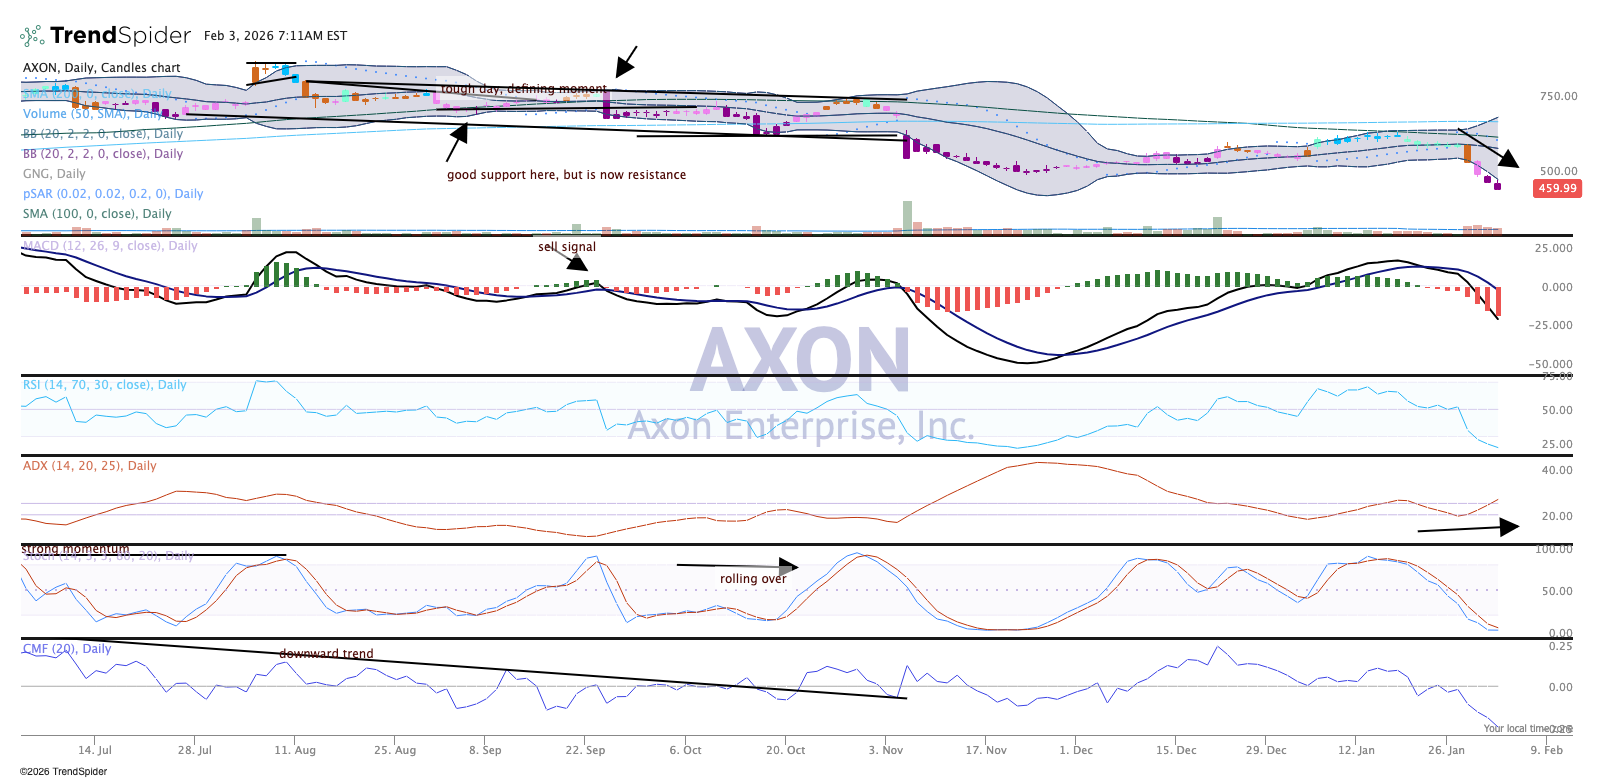
Money flow, at the bottom of the chart, is bearish. The Average Directional Index, or ADX, at the middle of the chart, is climbing. This means the trend is strengthening (down). Momentum is bearish.
There is nothing positive about this chart. The fundamentals may still be strong but the chart is telling us otherwise.
We rate Axon a One in Pro Portfolio and added shares Tuesday morning on weakness.
TheStreet Pro Portfolio is long AXON.
