Chart of the Day: Elastic Looks Stretched Out
The stock has made a monster move since April but is now at the bottom of a long range, and below resistance.
You've reached your free article limit
You've read 0 of 1 free Pro articles.
Elastic ESTC has had a really nice move up since the recent lows in April. No question this last move up is a bullish trend, with higher-highs and higher-lows. But moving back into the yellow box is not all that impressive. Sure, the stock has bullish indicators but it appears they are exhausted.
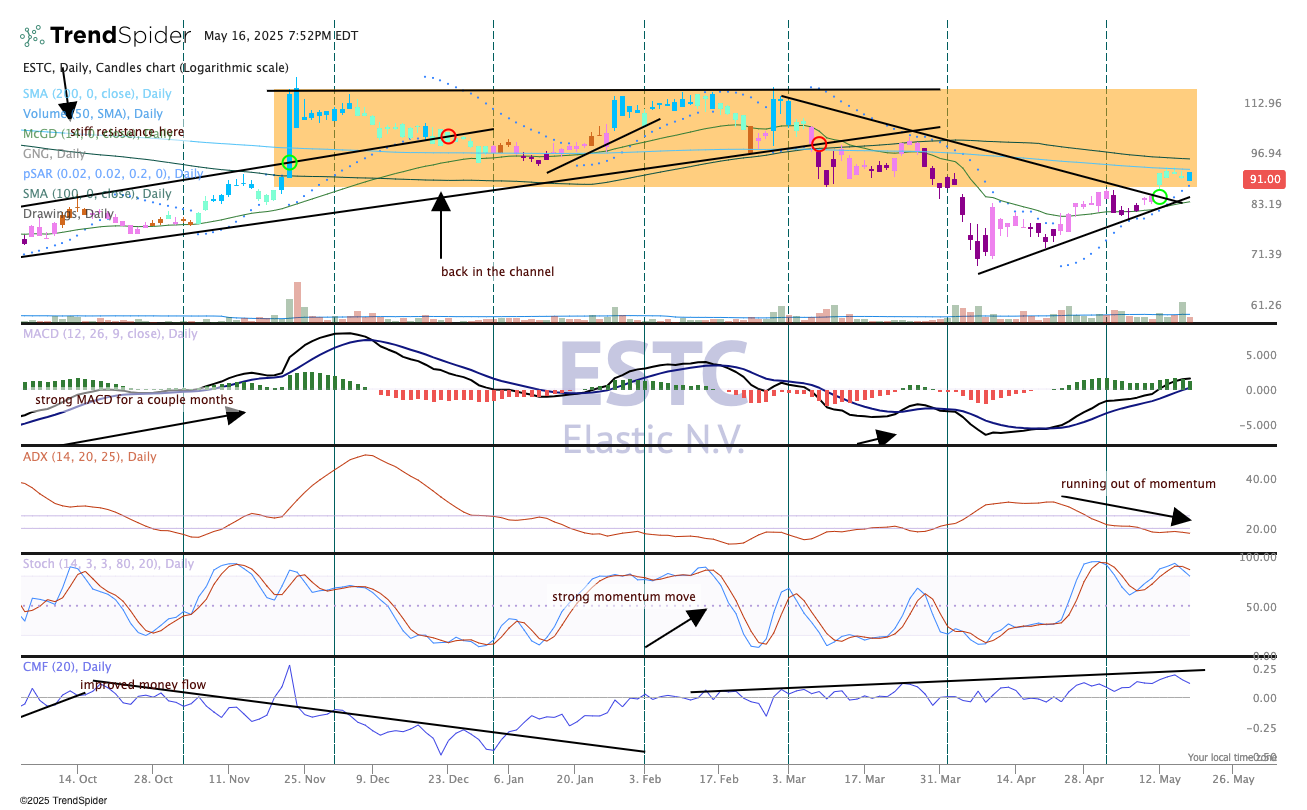
Take the Average Directional Index, or ADX, in pane 3. This indicator zoomed up to 30, a strong trend but now it has been deflated.
Money flow, as seen in the bottom pane, has also stalled at this recent high, and while Elastic appears to have broken through that drawn-in triangle, there is a worry this stock may just fall out of the box and test those April lows, call it $69 or so.
With earnings as a catalyst coming up soon, we'll wait anxiously to see if buyers add to their positions at this current price level.
We like Elastic in TheStreet Pro Portfolio and rate it a "One," buy at anytime.
The Pro Portfolio is long Elastic.
