Chart of the Day: Dutch Bros' Outlook Sweetens
The indicators are brewing up a more substantial move higher after sliding sideways for a bit.
You've reached your free article limit
You've read 0 of 1 free Pro articles.
As the smoke cleared from a fantastic earnings report in November, Dutch Bros BROS stock has been steadily moving higher.
But back in December, the stock moved sideways, a nice consolidation after a strong move up. Why is that considered a positive? For one thing, it tells us buyers are active and supporting the stock on the dips. In addition, a steady move is necessary after a strong move up, remember 'the longer the base, the higher the space (Louise Yamada).
If you look at the second pane of the chart below, you can also see the Moving Average Convergence Divergence indicator is crossing over for a buy signal.
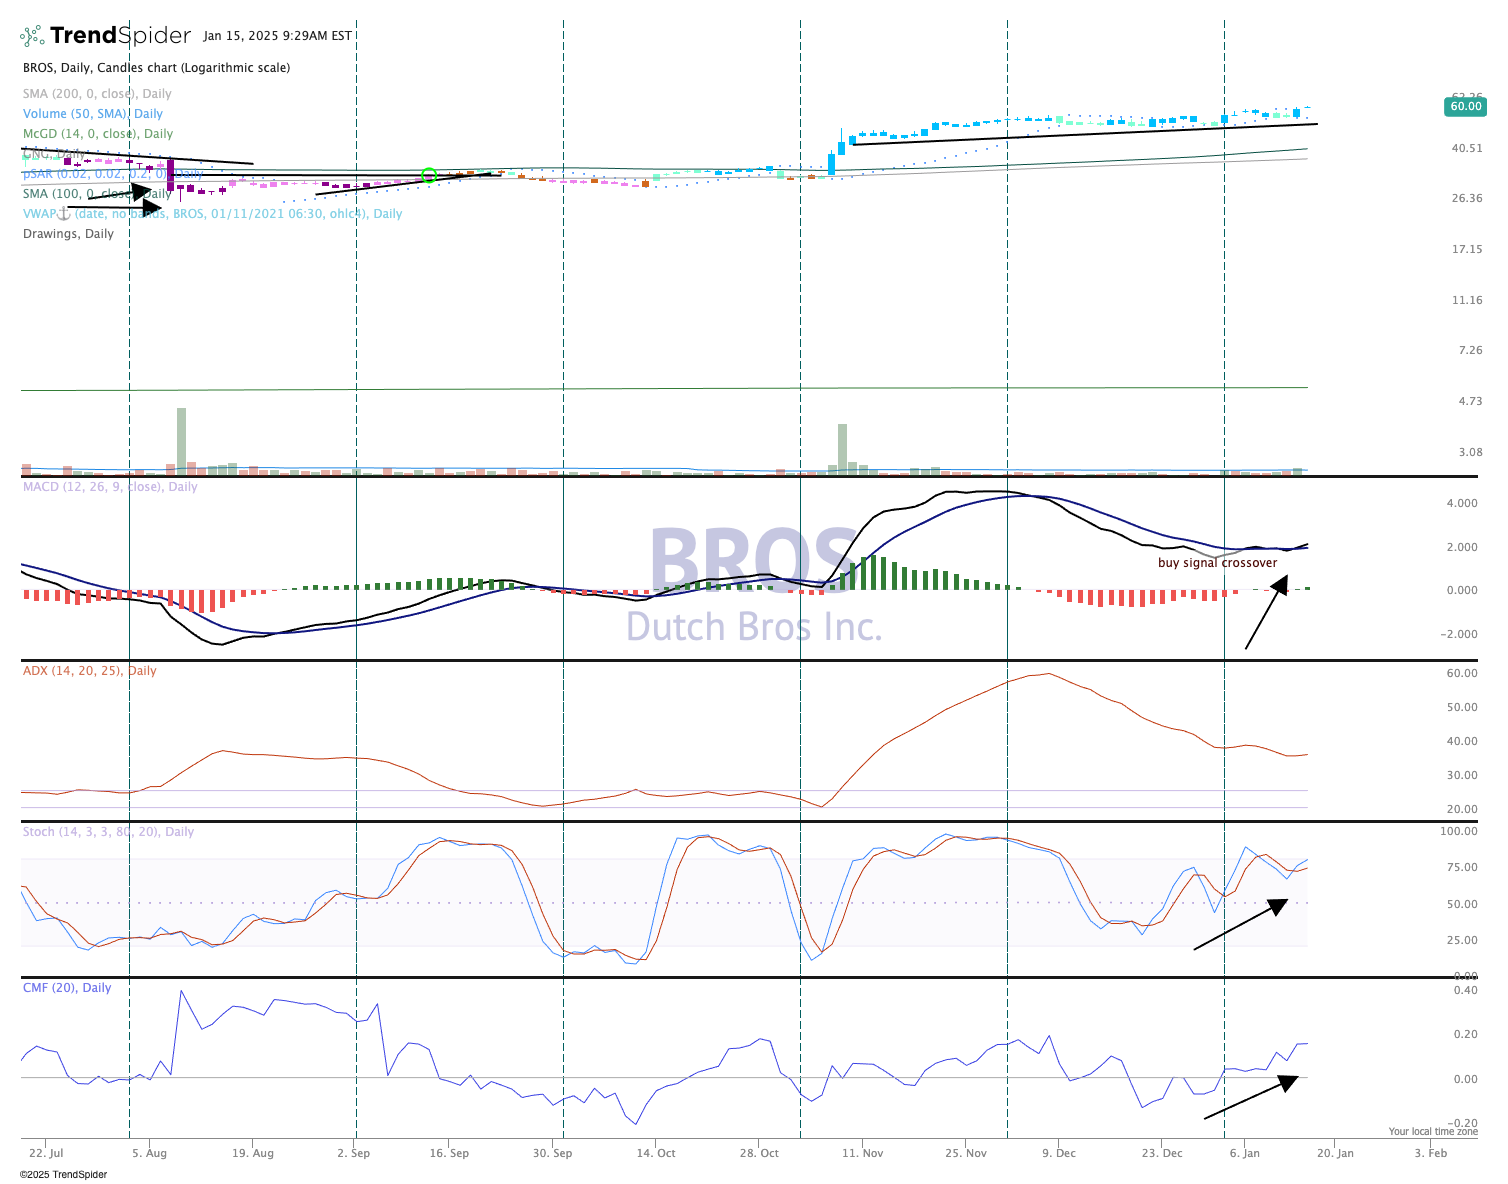
Also, the stochastics (momentum) indicator in the second-to-bottom pane is on the rise. So is money flow, as seen in the bottom pane.
The Parabolic SAR (stop and reverse, dots in the top pane) has just turned bullish, and the chart shows mostly blue and teal colored candles.
Back up at the top of the chart, we can also see it's bullish on the GoNoGo composite of indicators. A recent appearance at the ICR Conference in Orlando was a positive and was a reason we upped the price target.
We like Dutch Bros in the Pro Portfolio and rate it a "Two," or buy on pullbacks.
The Pro Portfolio is long Dutch Bros.
