Chart of the Day: Dutch Bros Makes a Pitstop as It Looks for a Charge
The 100-day moving average should provide the stock a level to bounce.
You've reached your free article limit
You've read 0 of 1 free Pro articles.
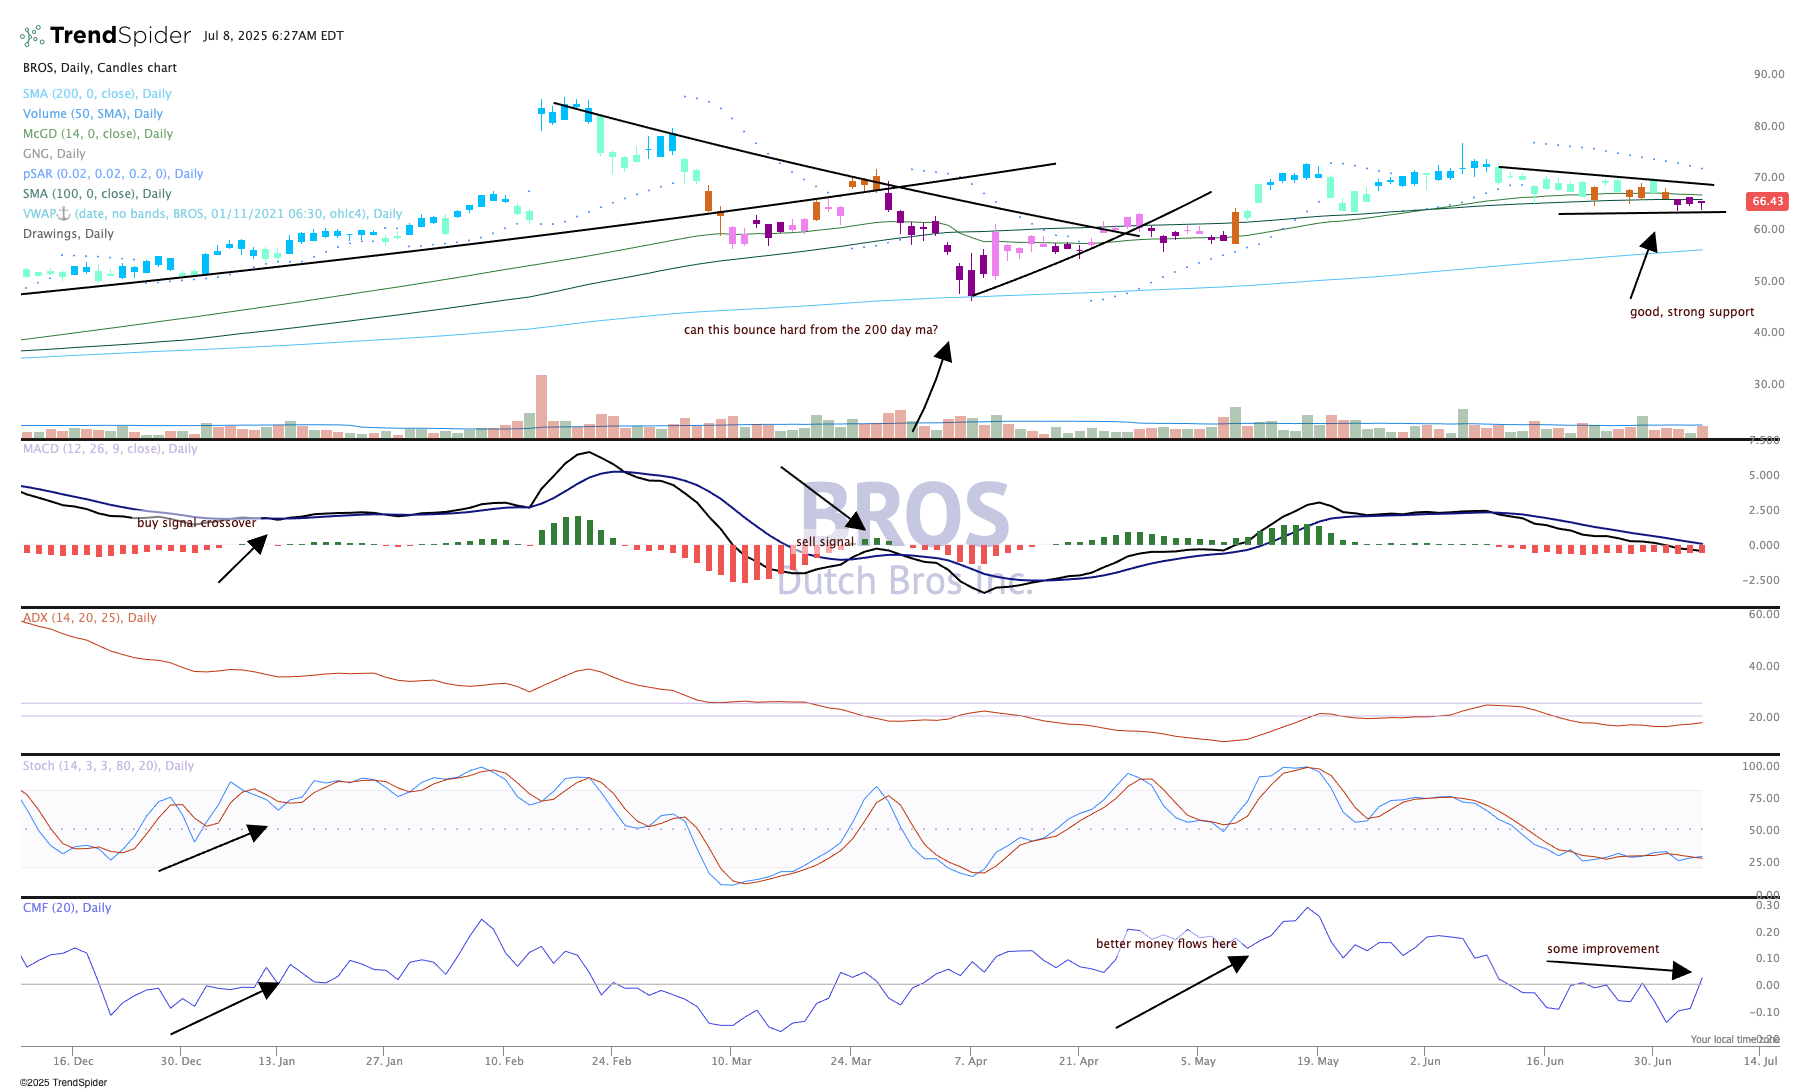
Dutch Bros BROS stock has been sliding of late and recently tested some strong layers of support. The 100-day moving average has been a strong level for BROS when the stock falls into it; on several occasions this happened and a sharp bounce occurred. That is currently around $67 per share. Just below there, however, lurks the 200-day moving average, which came into play back in early April, serving as a powerful bounce point when the stock became very oversold.
So, what are indicators saying here and what is next for Dutch Bros? Clearly the indicators are pointing bearish, with the candles now purple, which means strong bearish in the GoNoGo composite of indicators. Money flow is turning up, though, and the stochastics (momentum) is flat as a pancake.
We don't expect too much excitement here with Dutch Bros until the next earnings, likely in early August.
We like Dutch Bros in TheStreet Pro Portfolio and rate it a Two, or "stockpile on pullbacks."
At the time of publication, TheStreet Pro Portfolio was long BROS.
