Chart of the Day: Don’t Look Now, But Amazon Is Making Its Move
Traders/investors often get intrigued with the big online retailer/cloud company before earnings are released.
You've reached your free article limit
You've read 0 of 1 free Pro articles.
There is nothing tricky about the Amazon (AMZN) chart as it continues to grind higher. The stock recently poked its head below the 200-day moving average but held firm at the $225 level and has had a nice 10% bounce from there. In fact, notice in the top chart Amazon has pushed above the long drawn-out resistance line taking us back to November 2025.
That is impressive, but even after this recent push the candle is only amber color, which is neutral (but far better than the purple just a few days ago). Just a couple more up sessions would get this candle in the bullish camp.
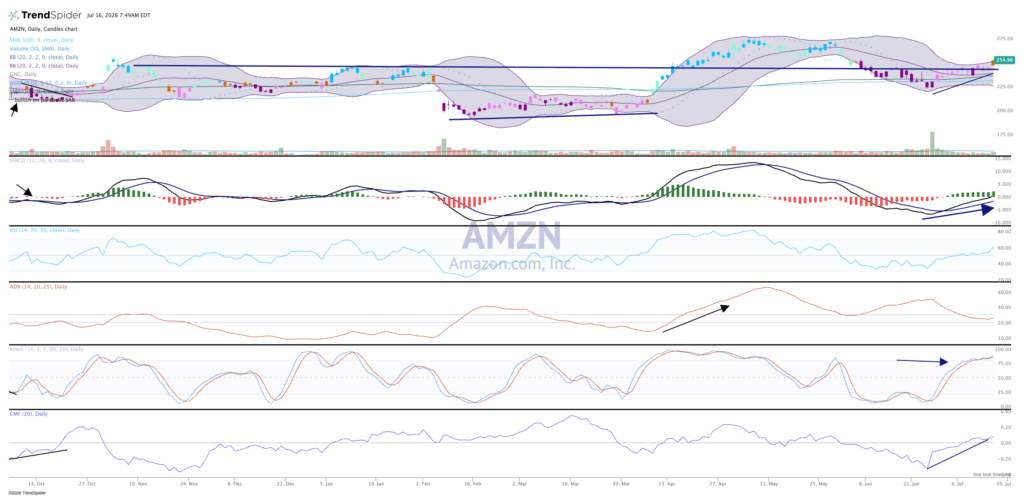
Relative strength is notable (pane 3), levels reached for the first time since late May. Money flow is bullish again, and option flow as been demonstrably bullish (more calls than puts being bought). MACD on a strong buy signal.
Has the stock run here lately priced in earnings? It is possible, but Amazon was in purgatory in the spring after a big miss, so maybe this time will be different.
We like Amazon in TheStreet Pro Portfolio and rate it a Two, or “stockpile on pullbacks.”
More Pro Portfolio:
- Adding to 3 Portfolio Holdings, Resetting 2 Checkpoint Levels
- 30 Signals Across the Portfolio’s 10 Themes and Strategies
- Weekly Roundup: Portfolio Extends Lead, Adds Firepower Ahead of Earnings Season
At the time of publication, TheStreet Pro Portfolio was long AMZN.