Chart of the Day: Costco Quietly Improves Its Position Ahead of Earnings
The stock was beaten down at the end of 2025, but has risen smartly near all-time highs.
You've reached your free article limit
You've read 0 of 1 free Pro articles.
While many investors were bashing Costco (COST) near the end of last year, worried the company's pricing and style were getting old in this "new age" of retail, the warehouse club just continues to perform. The company posted strong monthly numbers for the holiday and will report the full quarter this coming Thursday (March 5). We preached patience and even added more shares when it traded below the $900 level, a huge opportunity.
Notice the twin bottoms in December/January? The stock found a firm bottom where big institutions found the right price to pick up shares. Nobody rings a bell telling you to step in and buy but the chart sure did a nice job here telling you this was the right move.
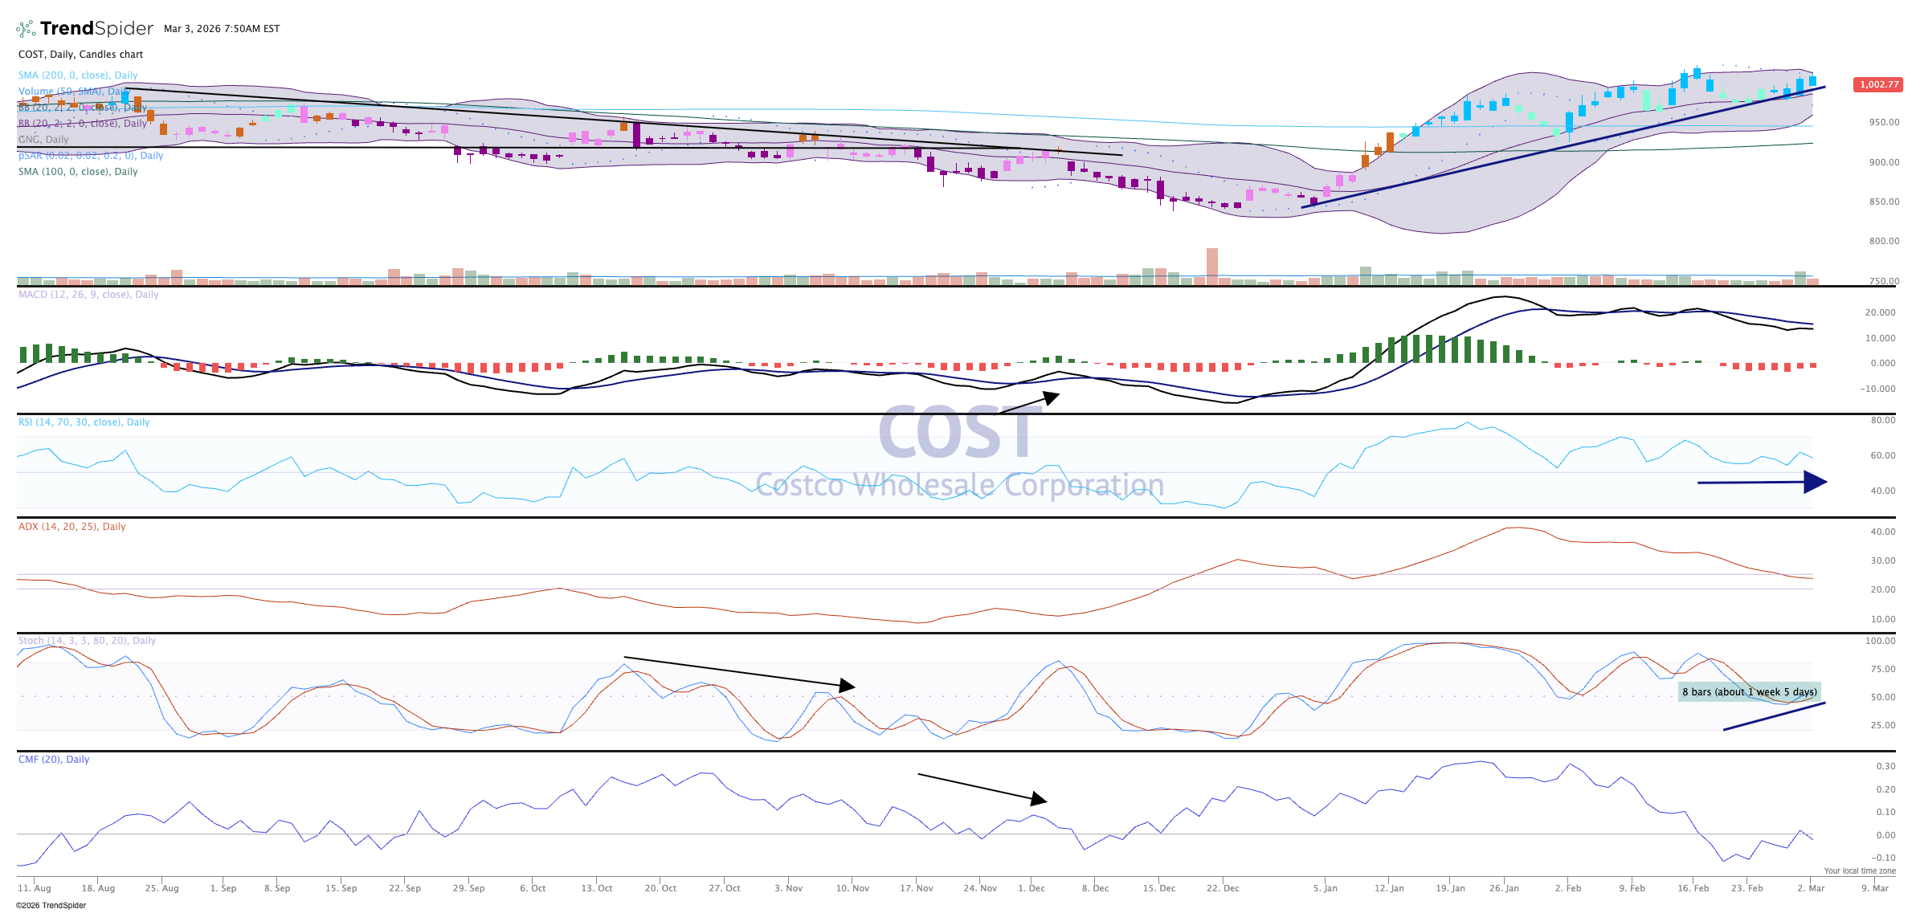
The chart shows marked improvement. The candles are now blue/teal, which is bullish on the GoNoGo composite of indicators. That is a far cry from the holiday period when Costco was firmly bearish with pink/purple candles.
Momentum is starting to rise, just in time for earnings. Stochastics, in pane 5, show the improvement, while MACD is on a sell crossover but that is not unexpected following a slowdown in price. The stock was on a huge run in early February, exhibiting great relative strength.
We like Costco in TheStreet Pro Portfolio and rate it a One, or "buy at anytime."
More Pro Portfolio:
- Selling Off Some Public Safety Shares After Big Gain
- Tracking 24 Portfolio Signals Across 9 of Our Investing Themes
- February Monthly Roundup: Uncertainty and Volatility Jump in Roller Coaster Market
At the time of publication, TheStreet Pro Portfolio was long COST.
