Chart of the Day: Can Microsoft Hit $600?
The Mag 7 name has been creeping higher of late as the technicals turn bullish. Let's chart out the path ahead.
You've reached your free article limit
You've read 0 of 1 free Pro articles.
It won't take much to lift Microsoft (MSFT) to an all-time high. The chart shows that point to be about $555, which is less than 4% above the current level. Microsoft has been impressive lately, but it could be doing much better, and with earnings this week as the catalyst those old highs may just be a distant memory soon.
Notice the power in the money flow at the bottom of the chart, staying up and showing more accumulation over the last six weeks. This is big institutional buying under the radar, as we see steady moves in the price of the stock as this chaikin indicator remains at a higher level. Stochastics in the second-to-bottom pane shows momentum is running higher but not overbought yet. The Moving Average Convergence Divergence, however, just crossed over for a bullish signal.
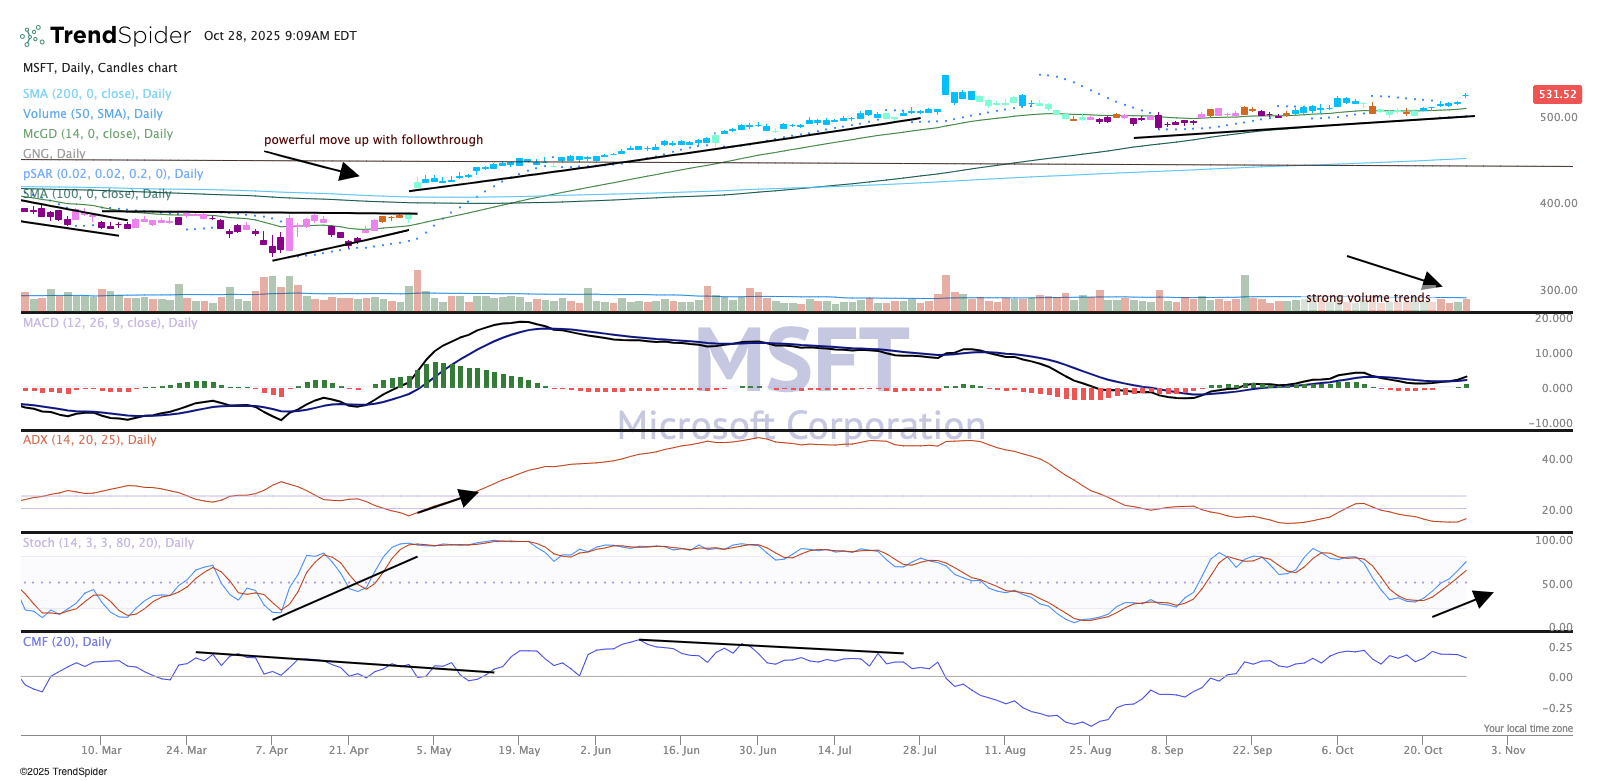
Staying above the relevant moving averages lately has been bullish for this chart, and the candles are blue, indicating that confirmed bullishness on the GoNoGo composite of indicators.
If the reaction is positive to earnings and other categories for Mr. Softy, we should see a big move eventually to $600. We like Microsoft in TheStreet Pro Portfolio and rate it a Two, or "stockpile on pullbacks."
More Pro Portfolio:
- We're Ringing the Register on Qualcomm After AI Chip News Drives Surge
- GM Cans EV Vans, L’Oréal Gets AI Makeover, More Investing News
- Weekly Roundup: Another Record High for the S&P 500 and Pro Portfolio
TheStreet Pro Portfolio is long MSFT.
