Chart of the Day: Bloom Is Creating Positive Energy as Big News Arrives
New highs might not be far off for this EPS All-Stars play.
You've reached your free article limit
You've read 0 of 1 free Pro articles.
When you’re a high-beta, high-octane name like Bloom Energy (BE) the share price can trade in a very big range. Further, the trend can break quickly and cause very deep pain if you’re long, but if you’re short the turns can be slow.
Notice the nice rise in the stock in April following a very nice earnings report. The trajectory of the move from the $180 area to $300 in a few weeks was very steep. You barely had a chance to get on board. That is what defines the best trends, too.
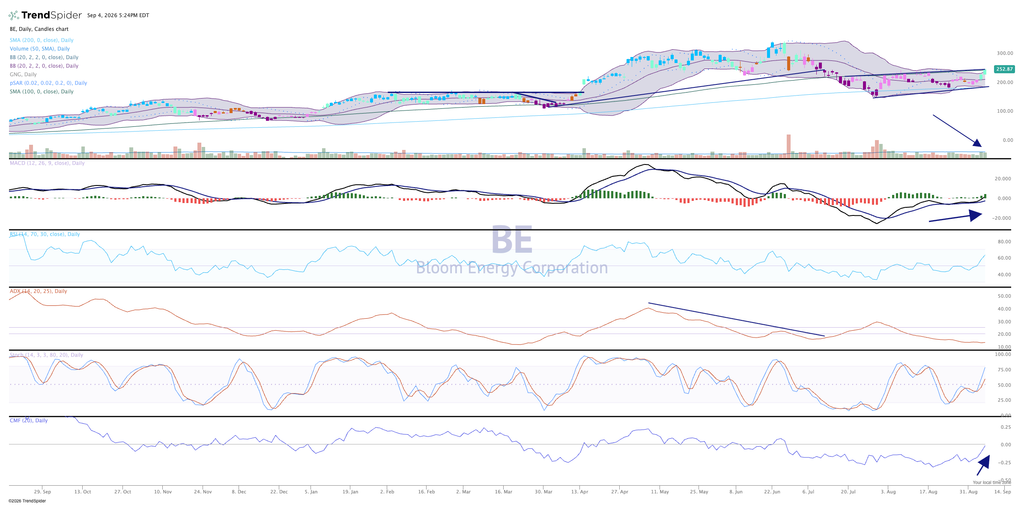
But as the stock went sideways for weeks it suddenly could not move higher, and then some sellers hit the stock hard, and a nasty downturn ensued. That took the stock downward and filled several gaps. It then settled down and now has a nice uptrend of higher highs, higher lows.
The chart is cautiously bullish, with teal candles. Volume trends have turned bullish. MACD is now on a buy signal, and money flow is showing improvement.
Meanwhile, after the close on September 4, it was announced Bloom Energy will become part of the S&P 500 index before trading begins on September 21, adding more potential buyers and upside.
As a current member of TheStreet Pro Portfolio’s EPS All-Stars basket, Bloom Energy does not have a rating.
More Pro Portfolio:
- Buying More of This Semi-Cap Play on Tightening Industry Capacity
- We’re Tracking 28 Signals Across 8 of the Portfolio’s Investment Themes
- Weekly Roundup: Maintaining Our Lead With a Telling Week Ahead
At the time of publication, TheStreet Pro Portfolio was long Bloom Energy.