Chart of the Day: Bank of America Tries to Fight the Bearish Trends
Could earnings flip to the chart to bullish? Let's check the indicators.
You've reached your free article limit
You've read 0 of 1 free Pro articles.
Can Bank of America BAC turn the trend from bearish to bullish?
The stock is fighting the bearish trends that were recently established by the secondary indicators. We were giving this chart the benefit of the doubt, because price action was still bullish. But the weight of evidence pulled the bullish trend off the table and now investors are wondering if earnings this week will turn the stock around. That might happen, however, the entire market is at a critical juncture as the bears weigh in on the stock market.
No question higher rates and potentially higher inflation are having an influence.
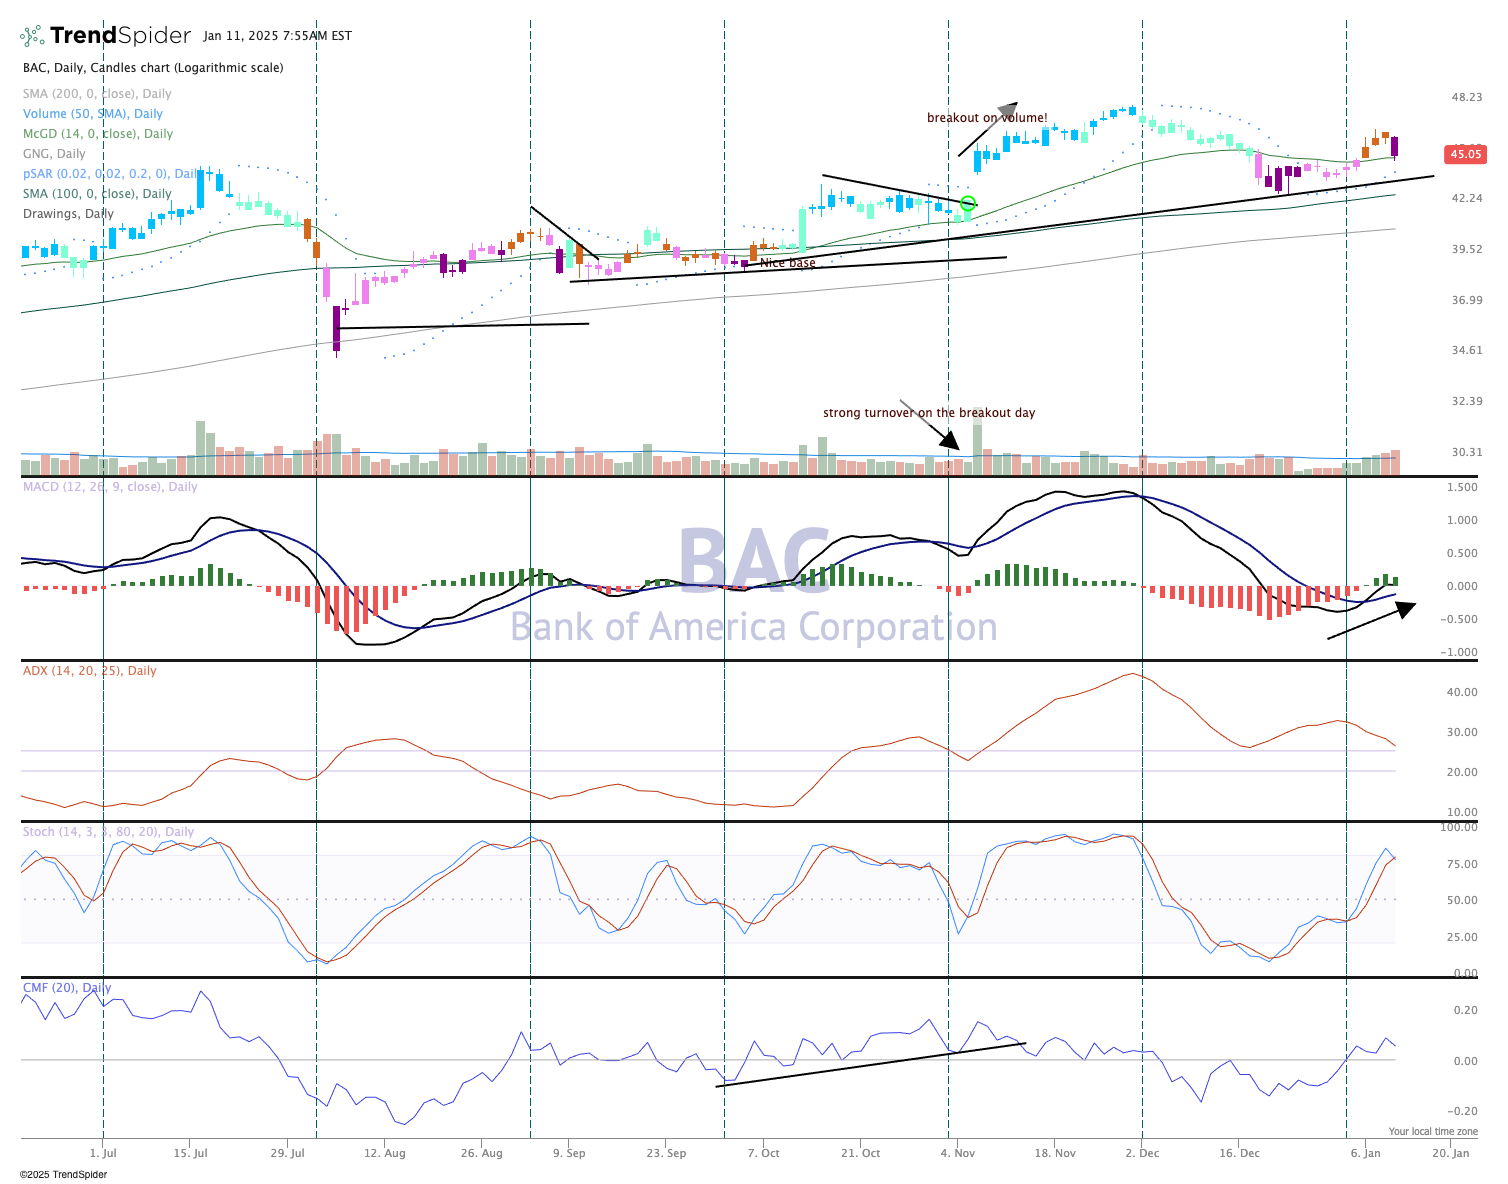
The stock is still in a long term uptrend, though now the candles have turned purple, which is bearish on the GoNoGo composite of indicators, as seen in the top pane of the chart.
The Moving Average Convergence Divergence, in the second pane, just crossed for a bull signal, but from a lower level, simply put the flip to bullish is not that impressive.
The average directional index, or ADX, in the third pane, remains lower and is heading down, indicating the bullish trend is ending for now. Money flow, as seen at the bottom of the chart, is improved, but is not flashing a buy signal. On the positive side, parabolic SAR (or "stop and reverse") in the top pane (dots on the chart), remains bullish.
After the release of earnings later this week, we'll get a better view of how this big bank is going to move in the weeks ahead. We like Bank of America in the Pro Portfolio and rate it a one, buy at anytime.
The Pro Portfolio is long BAC.
