Chart of the Day: Amazon Is Starting to 'Get Charged Up'
The stock is building a nice base at current levels and displaying bullish qualities.
You've reached your free article limit
You've read 0 of 1 free Pro articles.
With retail sales in question this summer as the consumer appears to be pulling back on shopping for goods, we must look at Amazon AMZN for some clues. No question the company has a stranglehold on purchases online, and with some bullish seasonality coming up and the next big shopping event (likely in mid-July) it's encouraging to see the chart starting to get charged up.
One thing we like to see after a big runup like Amazon had in April/May is a rest period where the stock moves sideways. This consolidation gives us better confidence that price lows are in and when the next move happens we can add to the position at a low risk entry point.
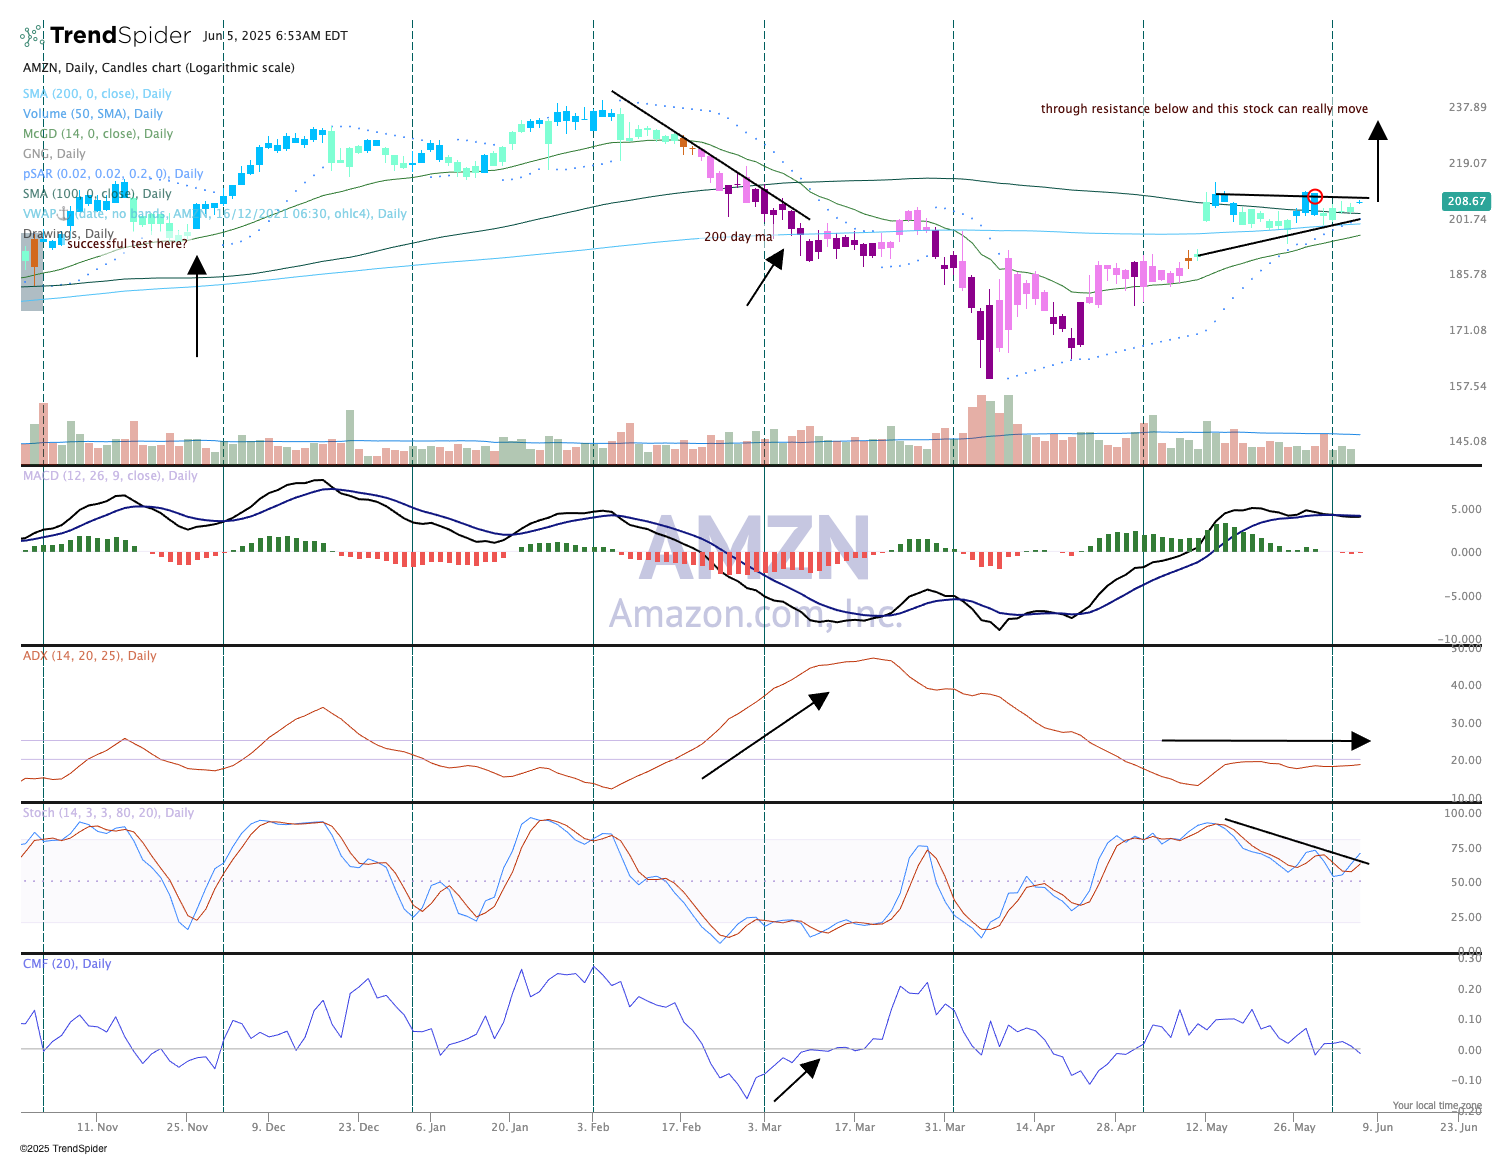
The candles recently turned blue/teal, which is bullish on the GoNoGo composite of indicators. MACD (moving average convergence/divergence) is overbought and stochastics (momentum) has fallen as one would expect with sideways movement.
The chart shows a tight base over the last three weeks; a breakout and confirmation above $210 would lead us to believe Amazon was on its way to the $250s. This chart is setting up nicely for that sort of move.
We like Amazon in TheStreet Pro Portfolio and rate it a One, or "buy at any time."
At the time of publication, TheStreet Pro Portfolio was long AMZN.
