Chart of the Day: Amazon Is Ready to Make a Move
The chart shows the price is turning at the right place and time.
You've reached your free article limit
You've read 0 of 1 free Pro articles.
Amazon (AMZN) has been a tricky stock lately. Notice from the recent range marked by the yellow box the stock just remains within the $210-230 area. It has been frustrating to watch the other Magnificent Seven names run higher while Amazon remains stuck.
But as is often the case, the best move for this stock is often after Prime Days, which just ended yesterday. These October dates are often the time shoppers get a jump on holiday discounts, stocking up on deals before Black Friday sales hit in about six weeks.
As it relates to Amazon, the other element is AI, web services and their growth initiatives. Are they producing for the company? Is there a worry about the fierce competition that lies ahead? We'll soon find out as the company delivers earnings for this past quarter at the end of October.
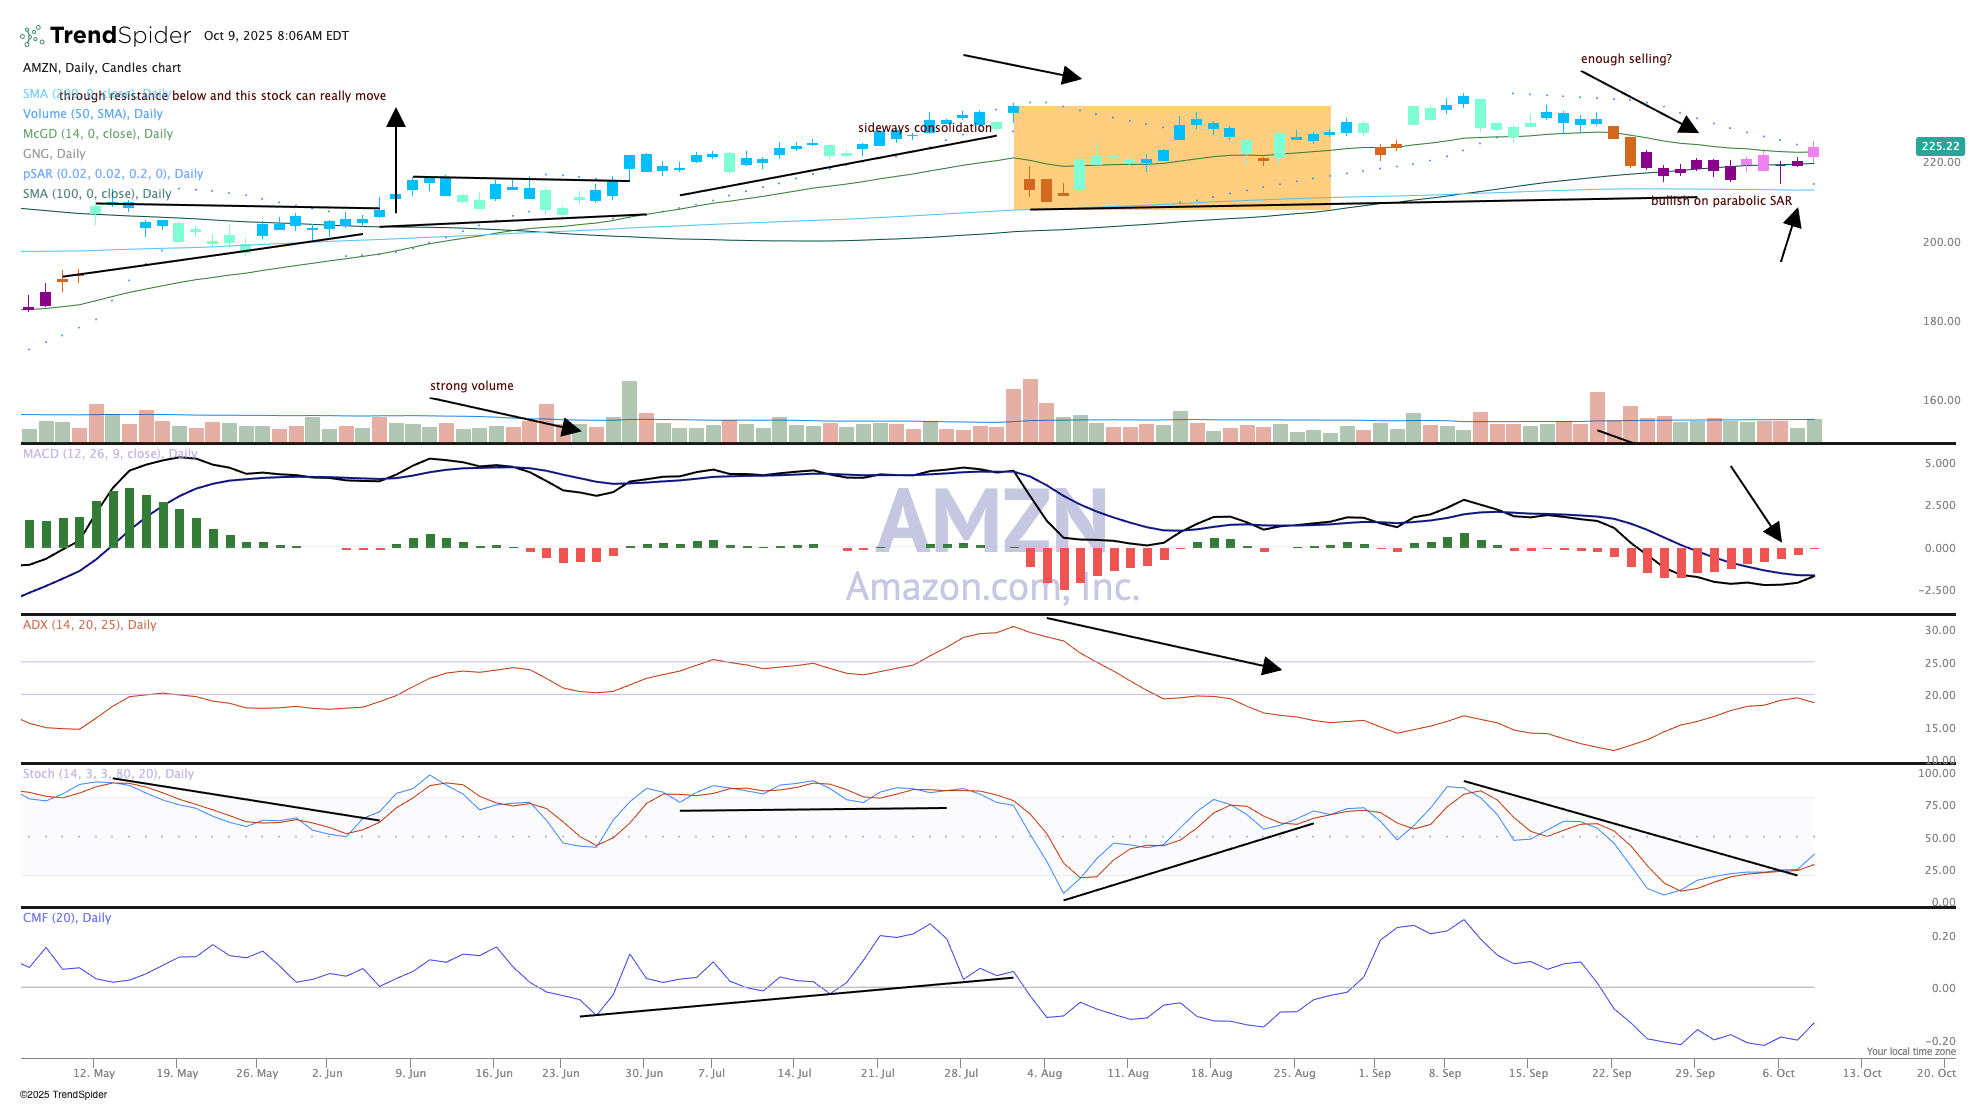
The chart is starting to show some improvement from a couple months ago. Money flow is perking up, and stochastics are starting to drive higher, which means momentum is returning to Amazon.
Moving average convergence/divergence (MACD) is about to cross and confirm for an important buy signal. Short-term, we can see another move to $230 and then a decision point.
Will it break the range or not? We think eventually it does and makes a run to $250-255.
We like Amazon in TheStreet Pro Portfolio and rate it a One, or "buy at anytime."
At the time of publication, TheStreet Pro Portfolio was long AMZN.
