Chart of the Day: Amazon Flashes a Warning Sign
The price chart remains bullish but probably not for long.
You've reached your free article limit
You've read 0 of 1 free Pro articles.
We don’t like to anticipate shifts in trends or price trajectory, but sometimes it becomes too obvious. With Amazon (AMZN), the recent pullback on lower volume tells us the sellers have less conviction, and when the buyers return they should snap up the shares, like we saw late last week. But is that really the case? Remember, price action is the king of all indicators, yet we need to be aware when secondary indicators are not cooperating.
Looking at the chart, the moving average convergence divergence and stochastics are on sell signals, and the parabolic stop and reverse just turned for a bearish sign. You can see down at the bottom, money flow turned down again after a weak attempt at going positive. Relative strength is moderate but looks to be heading lower. But up top, we see the candles are blue, indicating bullish conditions in the chart. I have to believe that another test of the 200 day moving average is on the way, where the stock bounced a couple of times over the summer and rallied sharply.
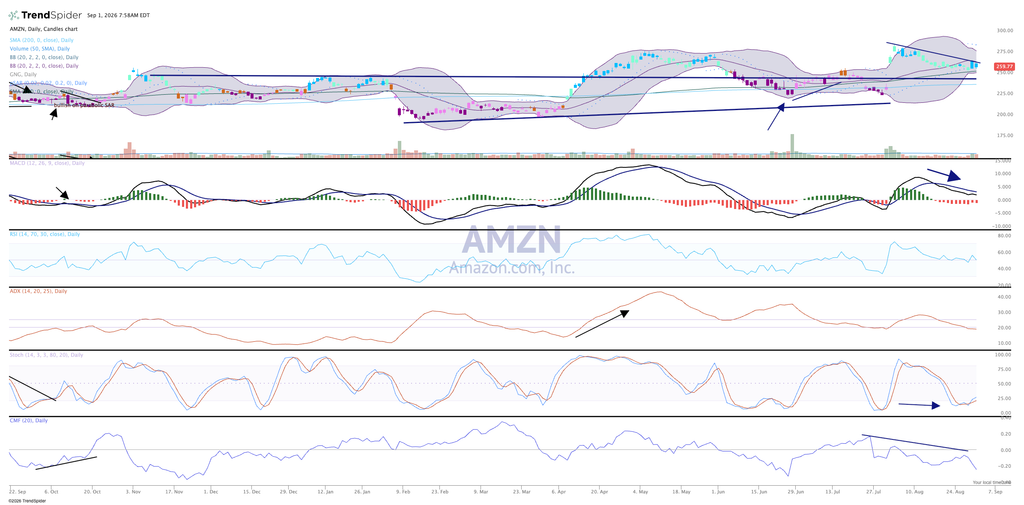
I see nothing much to move the stock higher over the coming weeks until earnings are released, and that would be toward the end of October. For now, we’ll be happy with some sideways action after a 10% drop from the all-time highs.
We like Amazon in the Pro Portfolio and rate it a two, stock pile on pullbacks.
At the time of publication the Pro Portfolio was long AMZN.