Chart of the Day: A Nice Run Right Up to a Decision Point
This ETF is now bumping up against important resistance. What now?
You've reached your free article limit
You've read 0 of 1 free Pro articles.
Will they or won't they? That's the question investors are wondering about the Uranium Nuclear Energy ETF NLR, which is bumping right up against important resistance.
That 50-day moving average in the top pane has been trouble for the past ten sessions, the stock making lower-highs and lower-lows in the process.
The chart shows the NLR in a downtrend, with lower-highs and lower-lows. The indicators look weak and momentum is coming out of the ETF here (stochastics, as seen in the second to bottom pane, headed lower), but money flow, in the bottom pain, remains bullish.
The top pane, however, tells the story: It is purple and reflecting bearish conditions via the GoNoGo composite of indicators.
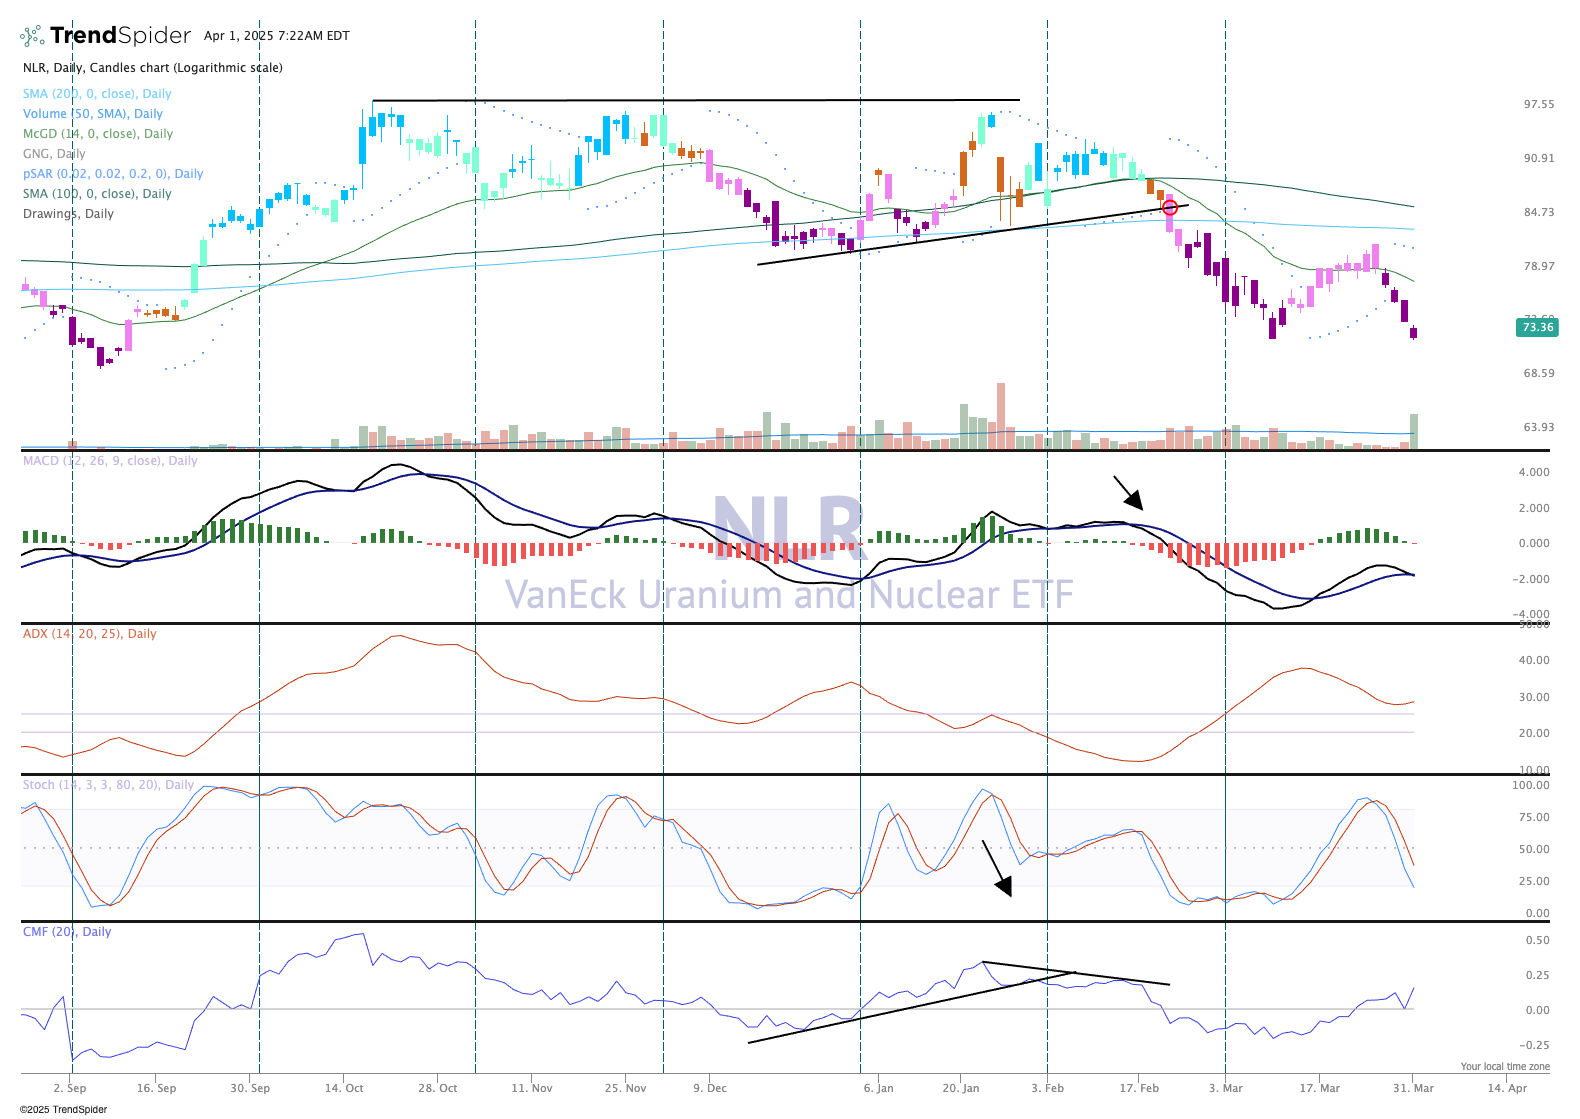
The price level is now back to where it was in early March; we'll see if we can get a bounce from here as it appears a range may have been established. If not, we see lower levels in the low $60 area as potential support.
We rate the NLR a Two in TheStreet Pro Portfolio or "stockpile on pullbacks."
More Pro Portfolio:
- We're Exiting This Semi-Cap Holding on Excess Capacity Concerns
- Monthly Roundup: March Lives Up to Its Reputation. Now for April...
- Energy Addiction, Walmart and Mom & Pop Cos. in AI, Luxury M&A and More Investing Headlines
TheStreet Pro Portfolio is long NLR.
