Chart of the Day: A Marvell Superhero
The stock has been on fire lately showing an excellent technical profile.
You've reached your free article limit
You've read 0 of 1 free Pro articles.
This Marvell Technology MRVL chart has lately been impressive. After taking a nosedive in the spring, the stock has been making a nice series of higher-highs, higher-lows — our textbook definition of an uptrend — and continuing to move upward in the face of doubters. That is the most beautiful part of the "wall of worry," when traders/investors stand back and refuse to participate, even if the company's story tells you to get in.
We like this chart of Marvell and notice there is plenty of room to grow on the upside. Though it seems the steps up have been slow and steady, that is consistent with previous uptrend patterns in this stock, so we're pleased with this approach.
The Moving Average Convergence Divergence is strong, as seen in the second pane. Money flow, as seen in the second-to-bottom pane, is still poor, but improving. Meanwhile, momentum is very good, as you can see in the stochastics on the fourth pane.
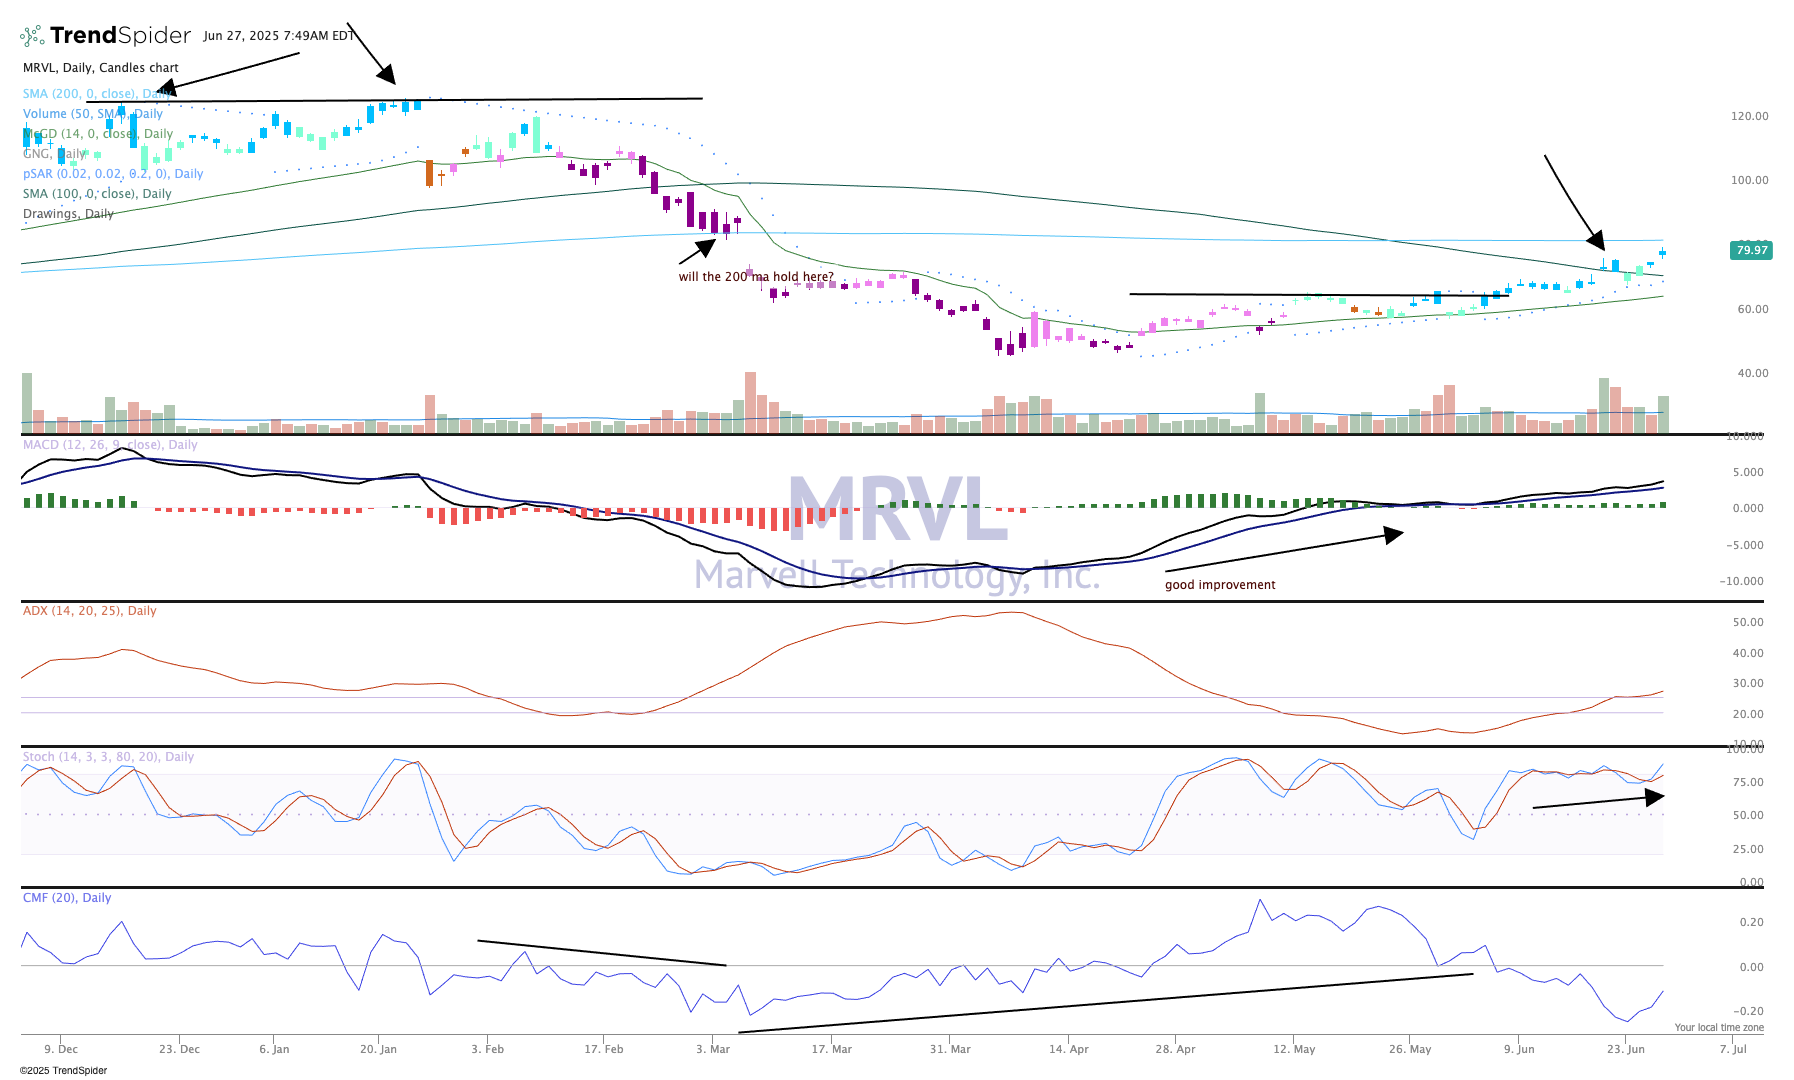
The top pane with price/volume is interesting. The stock recently passed the 200-day moving average on strong volume and confirmed it the next day (last week, arrow). The candles are bluish in color, which means very bullish on the GoNoGo composite of indicators.
With all-time highs more than 50% away from current levels, we'll proudly hold this name and look for more opportunities on the pullbacks, which have been available over the past three months.
We like Marvell in TheStreet Pro Portfolio and rate it a One, or "buy at anytime."
At the time of publication, TheStreet Pro Portfolio was long MRVL.
