Chart of the Day: A Look at Amazon as Prime Big Deal Days Approaches
The stock has been weak of late but does that mean another buying chance has arrived?
You've reached your free article limit
You've read 0 of 1 free Pro articles.
One thing you might notice about the Amazon's (AMZN) daily chart are the big swings up and down. That is quite normal for this name, a major player in retail, data centers, AI and entertainment.
The stock was on a roll from spring to late summer until last quarter's earnings report disappointed investors. The stock went tumbling, down nearly 8% on heavy volume and suddenly the pattern needed to be reset.
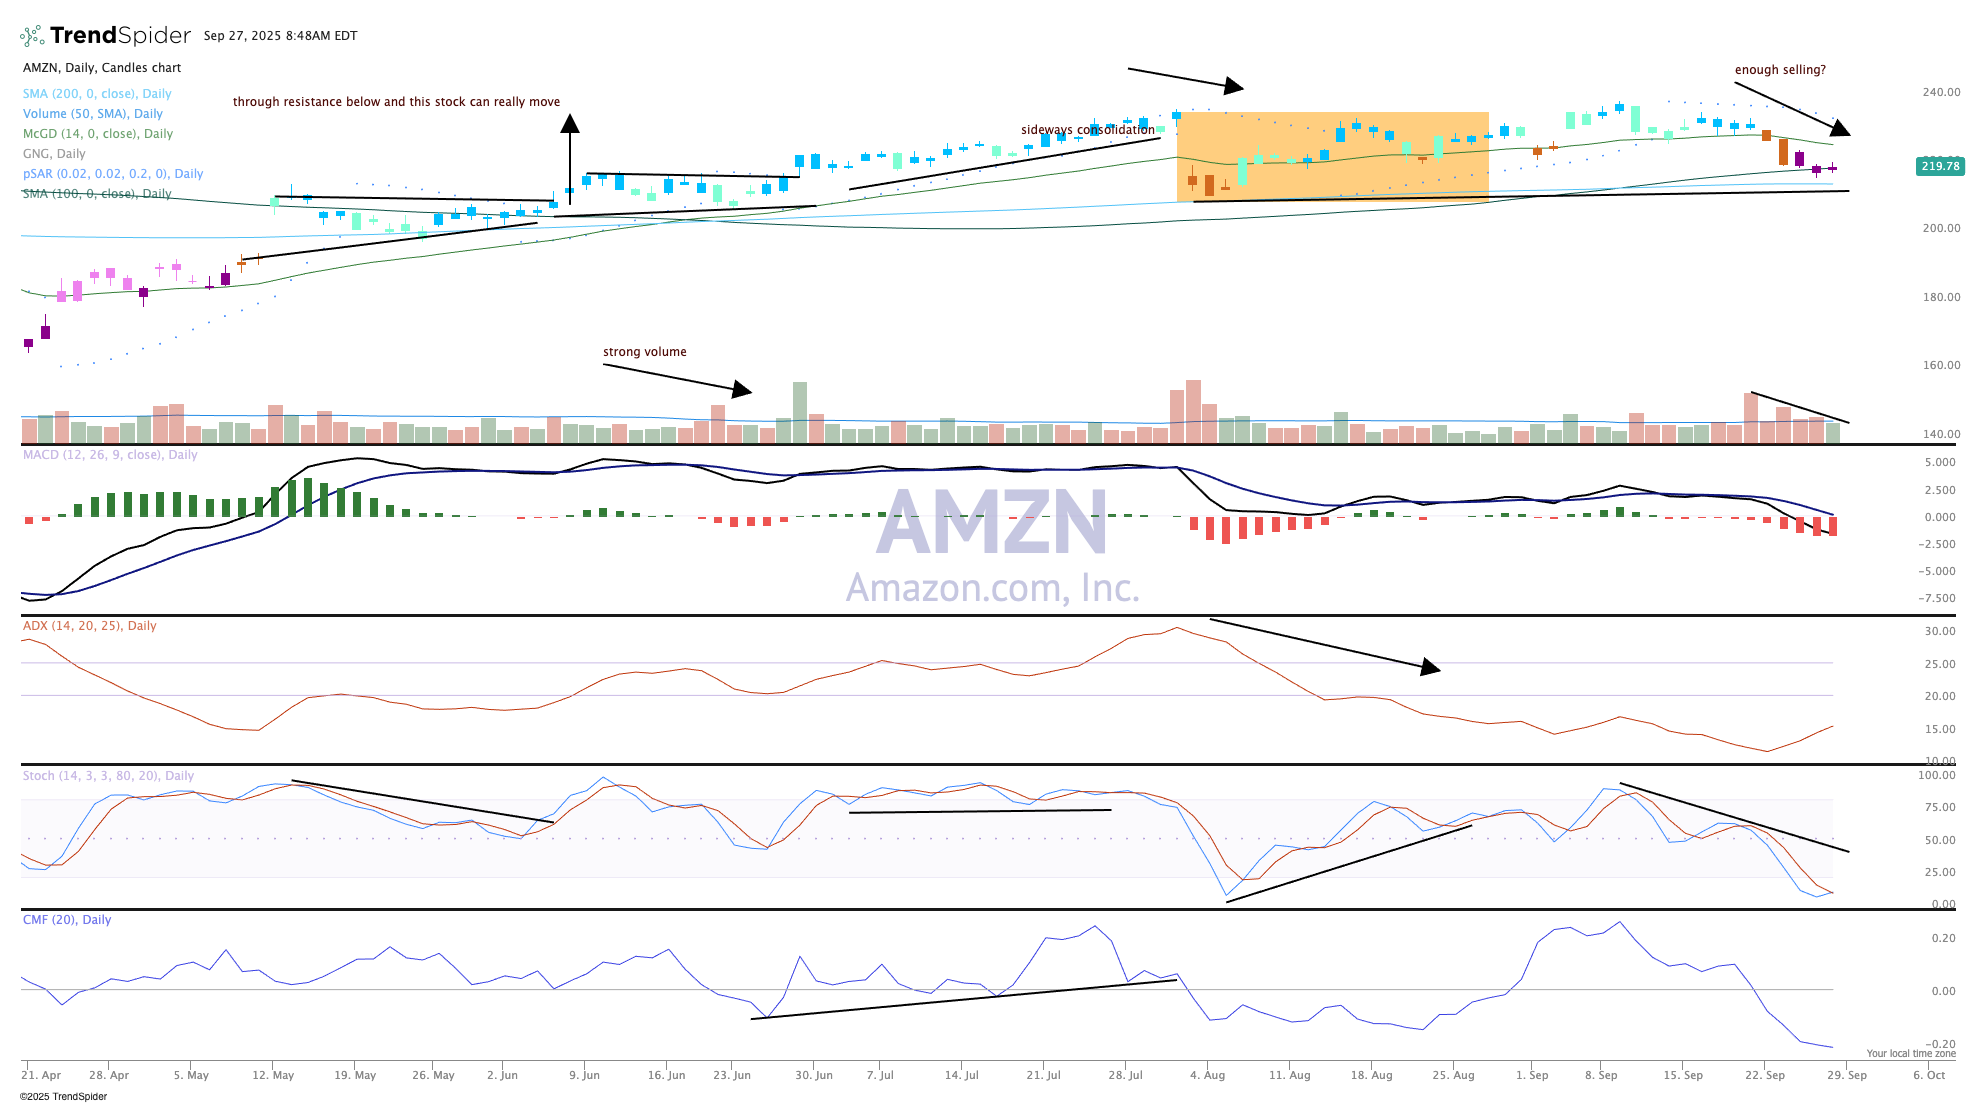
From that point (early August) it appeared Amazon was on the right path, moving up with higher highs, higher lows until this most recent attack by the bears. Something to be worried about? Not really, in fact at this point the buy setup is pretty strong.
Holding the low from that yellow box is key, but also sitting on the 100-day moving average and rising from there (currently) would be bullish. So, if the stock fails to hold here there is more support at about $211 where the bulls will likely hit the exits from disgust.
Stochastics have bottomed (pane 4) and is starting to turn up. The other indicators are still bearish but look washed out; when this happens is often the moment Amazon rises up, when nobody expects it to happen.
Remember, Prime Day is coming up in a few weeks. The last one in July seemed to be a huge success.
We like Amazon in TheStreet Pro Portfolio and rate it a One, or "buy at anytime."
More Pro Portfolio:
- We're Using a Market Overreaction to Scoop Up More of These Shares
- Koreans Turn to Ralph Lauren; AI for the Elderly & More Investing News
- September Portfolio Roundup: Defying History to Build on Our Gains
At the time of publication, TheStreet Pro Portfolio was long AMZN.
