Chart of the Day: A Holding Hits Resistance Before Earnings. Now What?
The stock is set to report earnings later tonight and has improved its position over the last month.
You've reached your free article limit
You've read 0 of 1 free Pro articles.
We often talk about the importance of the price action. We should always defer our analysis to include a higher weight towards price, as that is truly the best measure of how a stock is performing.
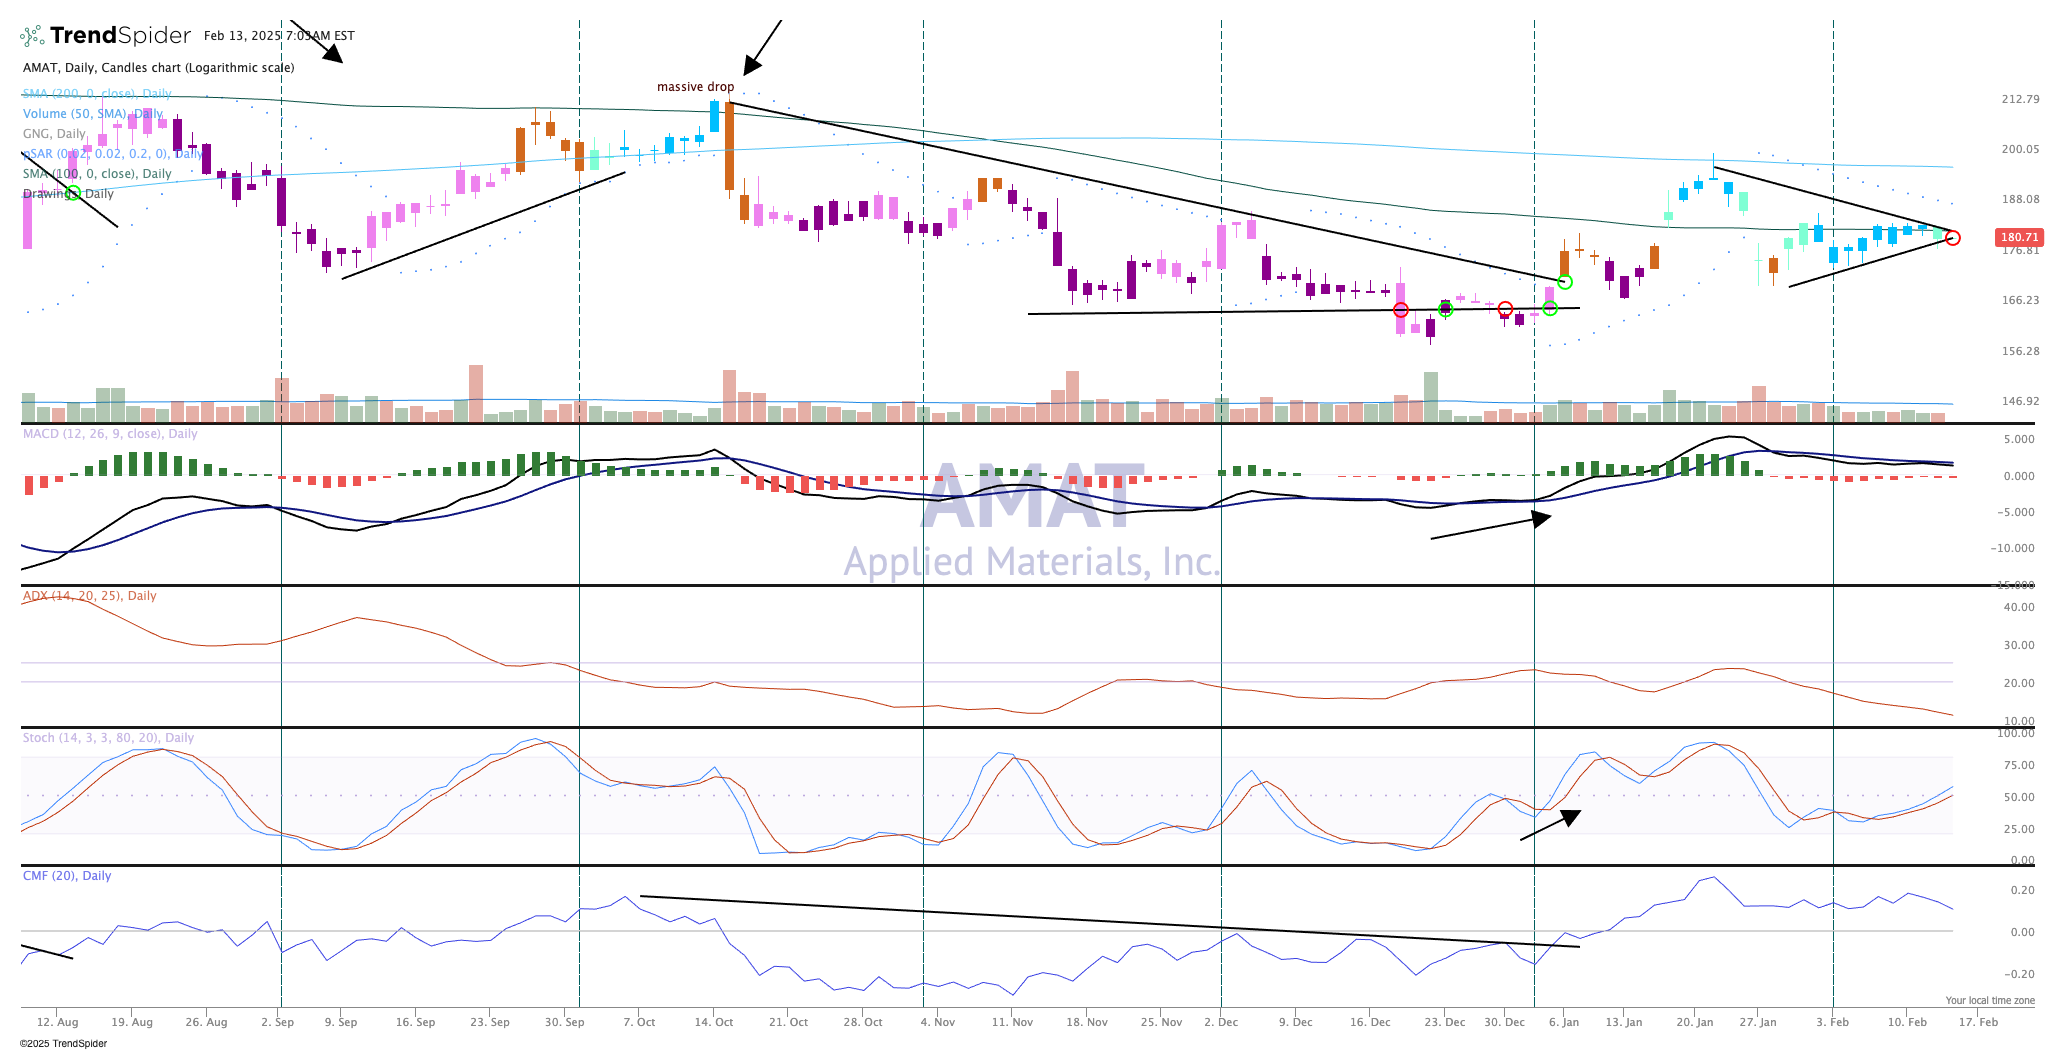
For Applied Materials AMAT, which has been beaten down repeatedly since the late summer with some massive drops (seen on the chart), the stock has started to climb the mountain and is now showing some bullish qualities.
Looking at the top pane, the candles are blue or teal, something we have not seen in AMAT for several months. That is bullish on the GoNoGo composite of indicators, so that is a bullish check mark.
Money flow is also bullish but is starting to point down as the stock finds resistance at its 200-day moving average. For its part, the AMAT chart shows a series of lower highs and higher lows, no trend established but still bullish from the previous segment which was bearish.
MACD (moving average convergence/divergence) is not on a buy signal here as the stock is moving sideways, and appears to have stalled.
What might push the stock higher to fill the recent gap and then back above the $200 marker? It could be strong earnings and guidance. No question the bulls are hungry for a strong quarter from this name, which disappointed last November, but that stock was in a severe downtrend. This time might be different.
We like Applied Materials in TheStreet Pro Portfolio and rate it a Two, or "stockpile on pullbacks."
At the time of publication, TheStreet pro Portfolio was long AMAT.
