Chart of the Day: A Curious Clue for Qualcomm
Let's check the big Q and see why it could be building a base -- and why money flow is one area to watch as institutional investors appear interested.
You've reached your free article limit
You've read 0 of 1 free Pro articles.
Qualcomm QCOM has frustrated us and many of its other shareholders lately with the back 'n' forth action that has trapped the stock within a range. For the better part of a month, QCOM has been trapped between $150-160, the range is well-defined here as momentum has been nascent or dropping for weeks. Can this stock regain some upward momentum?
It is possible, but the big Q needs to really improve its standing while still carving out a base. The Moving Average Convergence Divergence indicator in the second pane is rolling over and is threatening a sell signal, meanwhile money flow, in the bottom pane, is curiously strong, telling us big institutions are still interested.
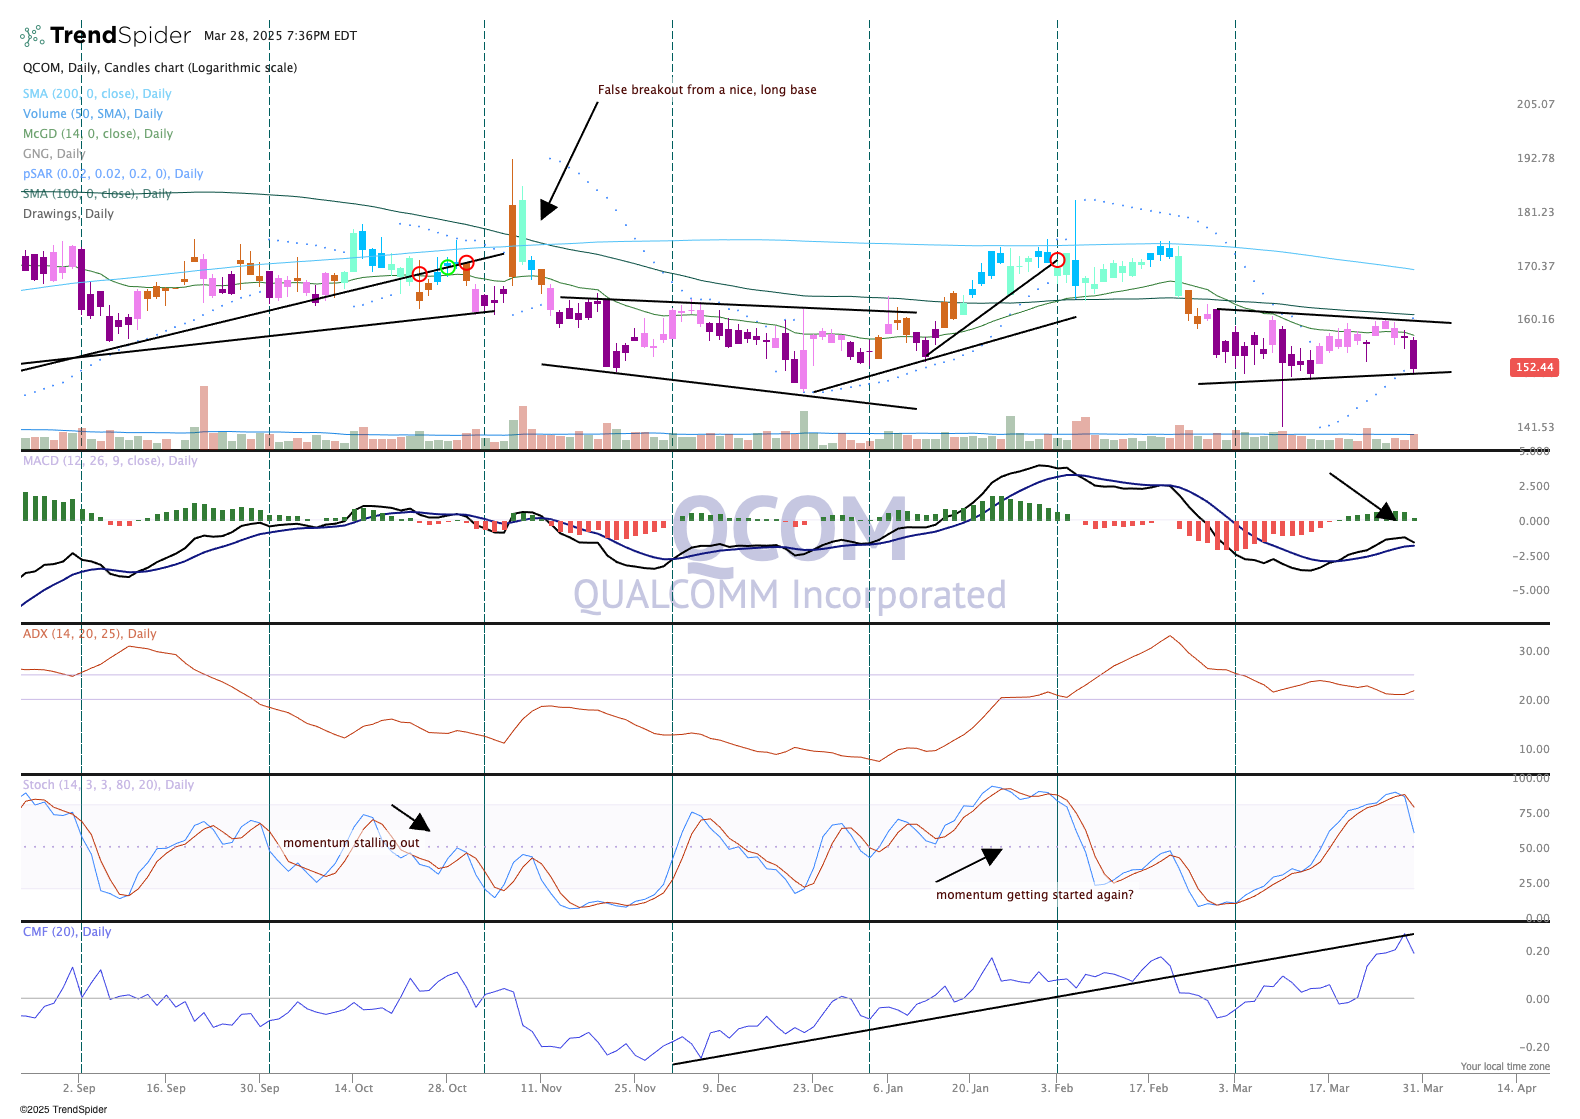
Yet, the price chart in the top pane tells the story, and that is clearly bearish. The candles have been pink or purple during this basing period, which persists. The parabolic stop and reverse, or SAR, in the top pane, is now flipped to a sell signal. The company will deliver earnings in about a month, so perhaps the basing will be over and a new uptrend will have been established. For now, it is just wait and see.
We like Qualcomm and rate it a "one" in TheStreet Pro Portfolio, buy at anytime.
The Pro Portfolio is long Qualcomm.
