Chart of the Day: A Close Look at American Express Ahead of This Week's Earnings
The company remains a leader and the technical setup looks promising.
You've reached your free article limit
You've read 0 of 1 free Pro articles.
Nothing like a modest pullback in your stock to give the dip buyers a chance to get on board. Remember, the best trends barely give you a chance to get on board, and American Express AXP is one of those names.
A series of higher highs, higher lows on this day chart followed by a nice, flat base built in May and June is what you look for in a bullish trend. The recent breakout from that base was on strong turnover, which tells us buyers were interested.
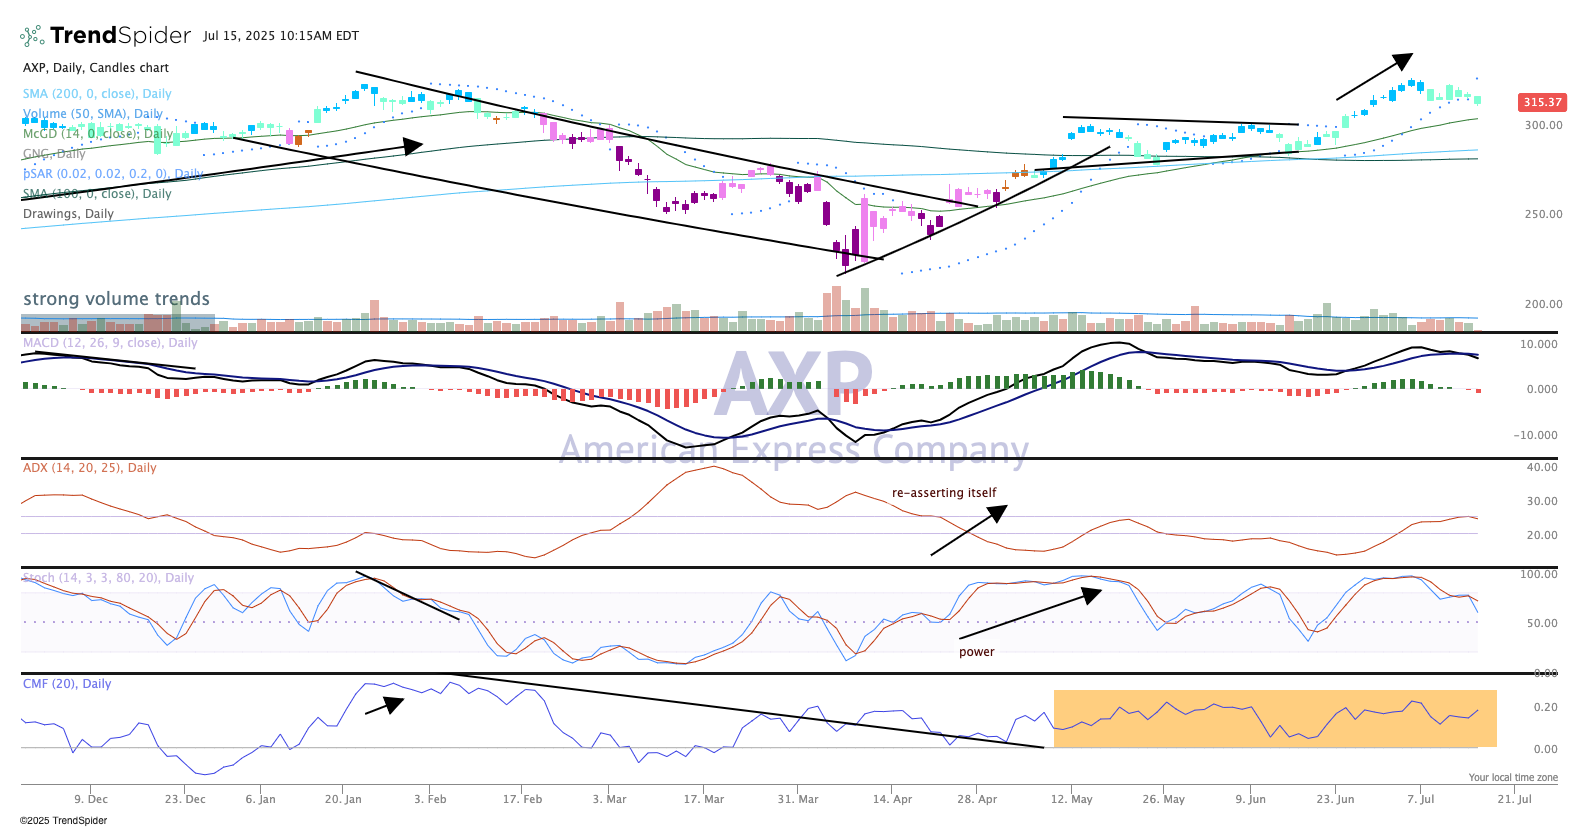
The indicators are still mildly bullish too. The MACD (moving average convergence/divergence) is rolling over here but that is due to the recent stall in price.
Volume trends are positive, and while the ADX may be headed lower it is not giving us a good signal either way. Lastly, the strong money flow at the bottom is indicative of big money flows into the stock, large institutions looking to add more.
We like American Express in TheStreet Pro Portfolio and rate it a Two, or "stockpile on pullbacks."
At the time of publication, TheStreet Pro Portfolio was long AXP.
