Monthly Roundup: Bracing for a Potentially Tumultuous Start to March
Multiple data points could renew market jitters, but eventually bring opportunities for the portfolio.
You've reached your free article limit
You've read 0 of 1 free Pro articles.
Many folks expected the return of Donald Trump to the White House to bring a fresh round of uncertainty as he embarked on his presidential agenda. As we know quite well, the stock market is no fan of uncertainty, and we were reminded of that in February. While the S&P 500 and the Nasdaq Composite rallied into the month-end close, the S&P 500’s year-to-date gain was less than half what it was exiting January, while the Nasdaq slumped into a year-to-date loss near 2.4% following its roughly 4.0% drop in February. Those market dynamics weighed on the TheStreet Pro Portfolio’s performance even though it recovered to finish February back in the black.
Friday morning, we shared a technical look at the S&P 500, noting its position below the 100-day moving average. The index rallied higher to close at 5954.50, just above the 100-day MA at 5952.58, which is constructive. However, as we discussed in the Daily Rundown on Thursday and Friday, we expected the market could have a positive reaction to the January PCE price index data, but believe the February data coming next week has the potential to renew market jitters should it echo the findings of S&P Global’s Flash February PMI. As a reminder, the report showed the Services sector falling into contraction territory, inflation accelerating and job creation cooling.
As it is, the latest rolling update for the Atlanta Fed’s GDPNow model pegs GDP at -1.5% for the current quarter, a sharp drop from its prior reading of 2.3% earlier this week. Our concern is confirmation of the Flash February PMI report in ISM’s February PMI findings could lead the GDPNow model to be revised deeper into negative territory. Weaker-than-expected February job creation numbers could be another driver of such revisions.
The start of expected Trump tariffs on Mexico and Canada, should they be put into motion, and this week’s latest round of tit-for-tat tariff hikes between Trump and China are another factor that could weigh on the market. This will have us listening very closely to retailers that report earnings next week, as well as company presentations at investor conferences. Should those comments raise questions about earnings prospects, it too could lead to renewed market jitters.
As Chris and Bob discussed in Wednesday’s Daily Rundown, March tends to be a seasonally weak month for the market, which is another reason for us to be on guard.
That combination means we will want to be extra careful to avoid being head-faked in the short term and jumping the gun in putting capital to work. Entering March, the portfolio’s cash and inverse ETF positions account for just under 11.5% of its assets, which offers nice firepower for us to strike should market forces drag existing holdings into oversold territory. We will, however, be mindful of the market’s technical setup and mindset as it reacts to next week’s February data, retailer earnings, and the next layer of Trump tariffs.
Should the S&P 500 push closer to being oversold, as we saw in August, that would likely bring about more pressure on stocks, but barring anything unforeseen, it would be a better spot to deploy more of the TheStreet Pro Portfolio’s cash. Rest assured we will be updating members regularly next week as we digest each of the coming February data points, sharing implications for the market and the portfolio's holdings.
Enjoy the weekend, and we’ll see you back here on Monday.
Catching Up on the Portfolio This Week
As the S&P 500 and Nasdaq Composite shed their January gains in February, the portfolio saw a similar move during the month, weighed down by its tech-related holdings. While that has the portfolio modestly trailing the S&P 500 as we move into March, we continue to outperform the Nasdaq Composite by a wide margin. Multiple times this week, we shared our analysis about the market’s near-term challenges that span its technical setup, extreme fear in the market, and upcoming data that could stoke renewed worries over the economy, job creation, and corporate earnings.
For those reasons, we opted for a defensive stance with the portfolio even though multiple holdings have come under, in some cases significant, pressure. Recognizing those factors were on the horizon, we built up the portfolio’s cash position in the second half of February by shedding Four-rated The Trade Desk TTD and booking big wins on shares of Costco COST, Meta META, Dutch Bros BROS, Waste Management WM, and First Trust Nasdaq Cybersecurity ETF CIBR.
We did put some cash to work by starting a fresh position in Axon Enterprise AXON this week ahead of the company’s latest quarterly earnings report. Those shares, along with those of Elastic ESTC, Dutch Bros, Costco, Waste Management, and Universal Display OLED, in addition to our SH and PSQ inverse ETFs, were positive forces for the portfolio during February. We also expanded the portfolio’s exposure to American Express AXP and ServiceNow NOW this week and upgraded the ratings on both to One from Two.
Now let’s check what Wall Street had to say about the portfolio’s holdings this week:
Axon caught multiple price target increases, with Barclays raising its to $726, TD Cowen to $725, and Argus to $700, following Axon's beat-and-raise earnings report this week. While we boosted our target to $625 from $600, we intend to revisit that new target following Axon’s presentation at the Morgan Stanley TMT conference on Monday, March 3.
KGI Securities initiated Costco shares with an Outperform rating and a $1,190 target.
Stifel upped its price target on Dutch Bros to $85 from $74, joining us at that level.
Following Elastic’s earnings this week where we boosted our price target to $140, Baird, Stifel, RBC, and Scotiabank upped theirs to $140, while UBS and Wells Fargo increased theirs to $148 and $150, respectively.
Truist lifted its target on Nvidia NVDA to $205 from $204, which in our view is simply silly, but BofA boosted its to $200 from $190 and Bernstein upped its to $185 from $175. We maintained our $175 NVDA price target following the company’s earnings report but shared that as Blackwell production matures, and margins rebound we’ll look to revisit it.
This Week's Portfolio Videos
We cover a lot of ground during the week in our Daily Rundowns. If you happened to miss one or more of them, here are some helpful links:
Monday, February 24: Why We're Playing Chess, Not Checkers This Week
Tuesday, February 25: How a Big Miss in Consumer Confidence Affects Our Game Plan
Wednesday, February 26: Versace and Lang on the Market, Fed, Portfolio Holdings and More
Thursday, February 27: Why Next Week’s 'Challenging' Data Will Be More Impactful Than Friday's PCE
Friday, February 28: We’re Not Taking the PCE Price Index Bait
Key Global Economic Readings
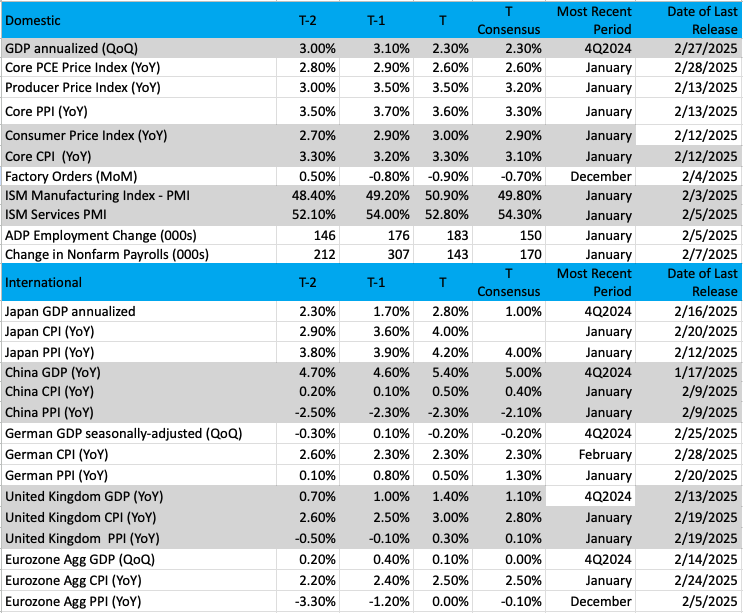
(Note: T is the most recent period, T-1 is the prior period's reading and T-2 is two periods back, the intent being to illustrate any trends)
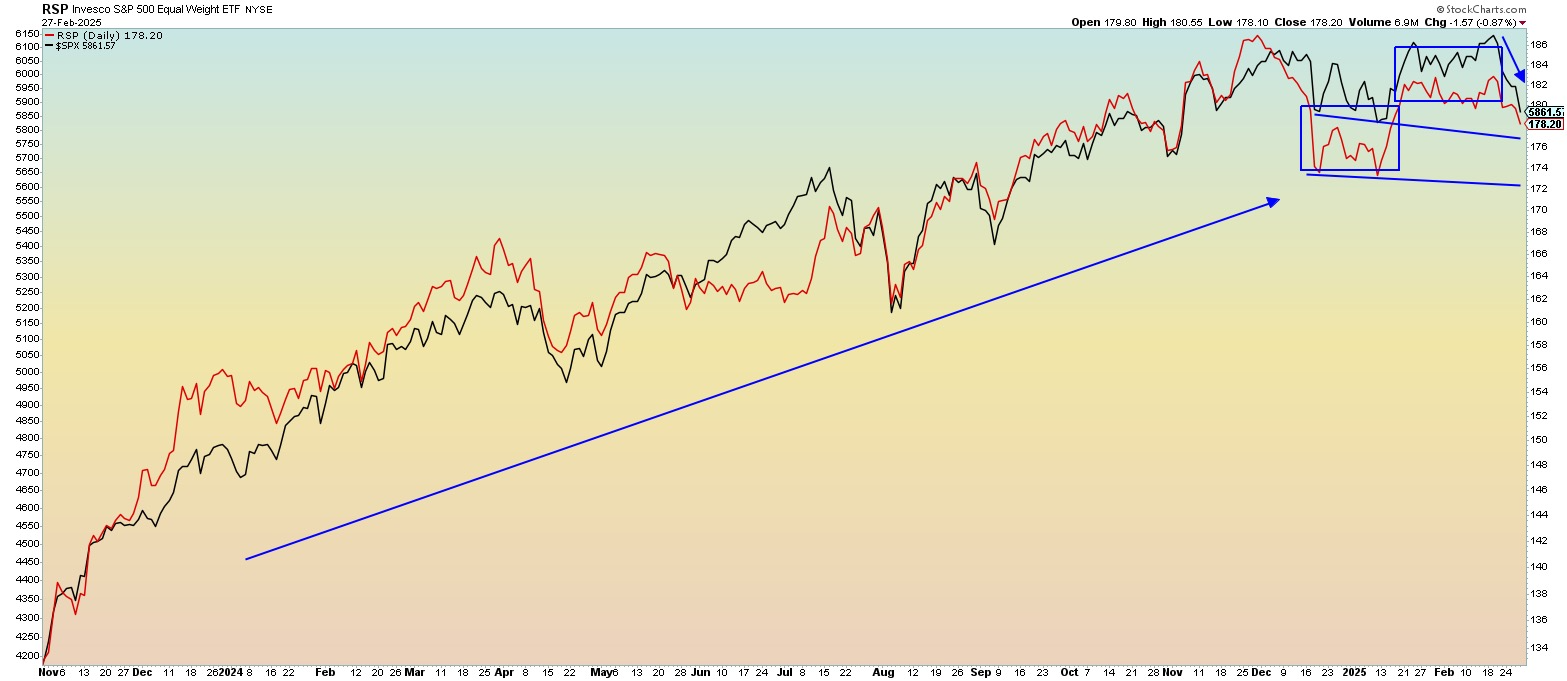
Chart of the Week: S&P 500 - Market Cap vs. Equal Weighted
It is the end of the month and time for a look at the S&P 500 weighted index, or SPY, versus the equal-weight index, the RSP. We have noted divergences before when these ETFs were far apart, but now they seem to be gathering steam to the downside and are nearly at the same point on the comparison chart. What’s next?
Well, the heavy weighting of the Magnificent Seven names and others have skewed the SPY over several years. The SPY is represented by the black line in the chart below, while the RSP is the red line. There has been a wide separation of the two (mostly) going back a couple of years, which is due to the outperformance of high-valuation names such as Apple, Meta Platforms, Tesla, Microsoft, and so on.
But looking now, the width or space (noted in the boxes in the upper right of the chart) is just about gone. That is due to the lack of performance in the big SPY names. No wonder the SPY was down worse than the RSP in February (SPY was down 1.3%, and RSP was off by 0.6%). We don’t often see the RSP performing better than the SPY for a long period due to the demand for such big names like the Mag 7 and before that FANG stocks (Meta, Amazon, Netflix, Google).
We applaud better performance by the RSP as it represents a much broader participation in gains by more groups than just technology-related names. A broadening out of the rally means more stocks in more groups are rising and creates a diversification within the uptrend and some "safety" when a correction occurs. Lacking this broadening puts investors at severe risk and vulnerability to large drops and no recovery if dip buyers fail to appear.
The trend is still bullish, though, for the long term, but the gyrations that occur on a short-term basis should make us all consider the trend. That is the wall of worry, up high for investors as they seek answers to future moves. Pay attention to the longer trend, which is easily identified by the big blue arrow that goes from the bottom left to the upper right. That matters most for investors following this trend until it changes.
Other charts we shared with you this week were:
Monday, February 24: S&P 500 - Index Starts to Feel the Pain as Bulls Hold Their Breath
Monday, February 24: VanEck Uranium & Nuclear ETF (NLR) - This Nuclear Energy Name Could Bounce Back
Tuesday, February 25: Nvidia (NVDA) - Nvidia Is Pulling Back Ahead of Blockbuster Earnings Report
Wednesday, February 26: Bank of America (BAC) - This Holding Continues Its Quiet Correction
Thursday, February 27: Axon Enterprise (AXON) - This Holding Is Just Getting Started
The Week Ahead
We begin the final month of the first quarter, and March tends not to be one of the market’s seasonally strongest. This time around, we’ll be bracing to see if Trump goes forward with expected tariffs on Mexico and Canada while his administration continues to study potential reciprocal tariffs on those as well as other countries.
Earlier this month, we received the first glimpses of February-facing data, which captured initial reactions to potential tariffs and Trump-Musk cost-reduction efforts across the federal government. We’ll be looking to see if the final February PMI data for the manufacturing and services economies confirms the findings of S&P Flash February PMI, which showed the services sector and job creation slowing, while inflation pressures mounted further. The same goes for ADP’s February Employment Change Report and the February Employment Report.
As we assemble those results and what February new order figures telegraph about March, we’ll revisit the Atlanta Fed’s rolling GDP model, which as of February 28 pegged current quarter GDP at -1.5%. That’s a sharp negative revision compared to recent iterations of that model and the revised 2.3% GDP figure for Q4 2024 that was released this week. Should next week’s data lead to further negative revisions to that rolling GDP forecast model, it will stoke renewed uncertainty in the market as well as concerns for corporate earnings and the market. As part of our review of that coming data, we’ll be comparing our assessment with those shared by Fed officials and there will be plenty of them next week.
Based on what we see in the published data, we’ll be looking to see if those comments from Fed heads stick with Fed Chair Powell recently sharing that the central bank needs to do more when it comes to inflation, or if they shift the narrative back to one centered on the jobs market as well as inflation. With the attention next week likely to be on tariffs, we’ll also be seeing what if any comments Fed officials make on that front and what it could mean for their inflation expectations and potentially monetary policy.
Here's a closer look at the economic data coming at us next week:
U.S.
Monday, March 3
· S&P Global Manufacturing PMI (Final) – February (9:45 AM ET)
· ISM Manufacturing PMI – February (10:00 AM ET)
· Construction Spending – January (10:00 AM ET)
Wednesday, March 5
· MBA Mortgage Applications Index – Weekly (7:00 AM ET)
· ADP Employment Change Report – February (8:15 AM ET)
· S&P Global Services PMI (Final) – February (9:45 AM ET)
· Factory Orders – January (10:00 AM ET)
· EIA Crude Oil Inventories – Weekly (10:30 AM ET)
· Fed Beige Book (2 PM ET)
Thursday, March 6
· Challenger Job Cuts – February (7:30 AM ET)
· Initial & Continuing Jobless Claims – Weekly (8:30 AM ET)
· Unit Labor Costs – Q1 2025
· EIA Natural Gas Inventories – Weekly (10:30 AM ET)
Friday, March 7
· Employment Report – February (8:30 AM ET)
· Consumer Credit – January (3 PM ET)
International
Monday, March 3
· Japan: Jibun Bank Manufacturing PMI – February
· China: Caixin Manufacturing PMI – February
· Eurozone: HCOB Manufacturing PMI – February
· UK: S&P Global Manufacturing PMI – February
· Eurozone: Inflation Rate (Flash) - February
Tuesday, March 4
· Eurozone: Unemployment Rate - January
Wednesday, March 5
· Japan: Jibun Bank Services PMI – February
· China: Caixin Services PMI – February
· Eurozone: HCOB Services PMI – February
· UK: S&P Global Services PMI – February
· Eurozone: Producer Price Index - January
Thursday, March 6
· Eurozone: European Central Bank Interest Rate Decision
Friday, March 7
· China: Imports/Exports – YTD 2025
· Germany: Factory Orders – January
· Eurozone: GDP (3rd Estimate) – 4Q 2024
It may be hard to believe, but yes, as we move into March, we still have quarterly earnings to contend with. The two portfolio companies reporting are Costco COST and Marvell Technology MRVL, and we’ll have more detailed previews in your hands next week. Outside of those reports, the expected wave of retailer earnings will be hitting.
Based on what we saw between Walmart and Home Depot, and tossing in the February Consumer Confidence and Consumer Inflation Expectations data, we’re not expecting a lot of good news. More likely we will see pockets of strength in some areas, while others take it on the chin. In addition to comparing quarterly comp sales figures from the likes of Macy’s, Abercrombie & Fitch, and Nordstrom to the three-month data contained in the January Employment Report, what these and other management teams say about the impact of tariffs will be high on our list.
From a 10,000-foot perspective, when we incorporate next week’s earnings reports we will have a nearly completely updated view of S&P 500 EPS expectations for the current quarter and 2025. Granted, those expectations could be in influx subject to Trump tariffs. That means that as we enter March and the wave of investor conferences it brings, we will have our ear to the ground on much more than economic data and lingering earnings reports.
Remember, we are not fix-it-and-forget-it investors, no crock pot investing here, which means as we get new information, data, and other insights we’ll adjust the portfolio as needed.
Here's a closer look at the earnings reports coming at us next week:
Monday, March 3
· Open: Surgery Partners (SGRY)
· Close: Okta (OKTA),
Tuesday, March 4
· Open: AutoZone (AZO), Best Buy (BBY)
· Close: Box (BOX), Credo Technology (CRDO), Nordstrom (JWN), Ross Stores (ROST)
Wednesday, March 5
· Open: Abercrombie & Fitch (ANF), Brown-Forman (BF.B), Foot Locker (FL)
· Close: Marvell Technology (MRVL), Victoria’s Secret (VSCO), Zscaler (ZS)
Thursday, March 6
· Open: BJ’s Wholesale (BJ), Burlington Stores (BURL), Campbell Soup (CPB), Macy’s (M)
· Close: Broadcom (AVGO), Cooper (COO), Costco (COST), Gap (GPS), Hewlett Packard Enterprise (HPE),
Portfolio Investor Resource Guide
· Economic Data: Here's a List of Links to the Key Economic Data We Closely Watch
· Investing Terminology: 16 Key Terms Club Members Should Know
· 10-Ks: Want to Know About a Stock? Read the Company's Reports
· 10-Qs: Unlock the Numbers and Key Information Behind Your Stock With the 10-Q
· Income Statement: Our Cheat Sheet to Understanding This Financial Document
· Balance Sheet, Cash Flow Statements, and Dividends: How to Know If a Company Is Off-Kilter? Read Its Balance Sheet
· Valuation Metrics: Everyone Wants a Value. Here's How Investors Can Find
· Thematic Investing 101 Webinar
The Portfolio Ratings System
1 - Buy Now (BN): Stocks that look compelling to buy right now.
2 - Stockpile (SP): Positions we would add to on pullbacks or a successful test of technical support levels.
3 - Holding Pattern (HP): Stocks we are holding as we wait for a fresh catalyst to make our next move.
4 - Sell (S): Positions we intend to exit.
ONES
Alphabet GOOGL; $170.28; 1,035 shares; 3.57%; Sector: Communication Services
UPDATE: Like many other shares of companies in the tech sector with exposure to data centers and cloud, Alphabet (GOOGL) was hard hit in February. That double-digit fall has landed GOOGL shares in oversold territory, more than closing the December gap in the chart, and that places them on our shopping list as we enter March. We will be checking the February global search market share data when it’s published next week, but make no mistake, Google is still far and away the search market share leader. When the company reported its quarterly results, as expected it outlined a far larger capital spending plan for this year of $75 billion, well ahead of the nearly $60 billion expected and the $52.5 billion spent in 2024. The bulk of that more-than-40% increase is targeted for “technical infrastructure,” including servers and data centers as the company continues to invest in AI and cloud. There were several positives found in Alphabet’s results. Probably the biggest was the continued climb in the company’s operating margin, which hit 32%, up from 27% in the year-ago quarter. That jump reflects continued gains at Google Services and Google Cloud in the face of ongoing AI and cloud investments to drive future revenue. Absent the losses from Alphabet’s other bets, the combined operating margin of Google Services and Google Cloud were over 36% in the December quarter, up 400 basis points year over year. As Google brings more cloud capacity onstream we should see a re-acceleration in Google Cloud, which mixed with ongoing cost reduction efforts should translate into similar action in the company’s EPS. We continue to see the company well positioned for AI adoption, given its treasure trove of data across its search, advertising, and YouTube businesses, which should benefit it in the coming months with an upswing in digital advertising. As AI matures, we see that resulting in further lift to Google Cloud’s revenue and profit generation. We’ll continue to evaluate our price target and rating as necessary.
1-Wk. Price Change: -5.2%; Yield: 0.5%
INVESTMENT THESIS: We believe that while search and digital ad dominance are what will carry shares in the near-to mid-term, longer-term it is the company's artificial intelligence "moat" that will provide for new avenues of growth. AI is what has made the company's search, video, and targeted ad capabilities best-in-class and is the driving force behind the company's success in voice (Google Home) and autonomous driving (Waymo). Furthermore, we believe it is this AI expertise that will also make the company more prevalent in other industries, including healthcare via its subsidiary Verily, as AI and machine learning continue to disrupt operations across industries. Adding to our positive view of the company's future opportunities, we believe that Alphabet's free cash flow generation and solid balance sheet set it apart and are what will allow the company to continue taking chances on far-out ground-breaking and potentially world-changing projects. The company is also preparing to roll out Gemini Subscription with enterprise plans for workspace, according to a report. All good news for Alphabet.
Target Price: Reiterate $210; Rating: One
Panic Point: $167
RISKS: Regulatory risk (data privacy), competition, and macroeconomic slowdown impacting consumers and therefore ad buyer activity.
Amazon AMZN; $212.28; 861 shares; 3.70%; Sector: Consumer Discretionary
UPDATE: Coming off Amazon's 7% gain in January, which led us to shed some shares and lock in a hefty win for the portfolio, AMZN gave more than that back in February. That move lower reflected a combination of factors, ranging from DeepSeek-related questions over AI spending to Microsoft reportedly dialing back its capital spending efforts, which the company has since pushed back on. To be fair, Amazon Web Services is capacity-constrained near-term and the current quarter has one less week compared to the March 2023 quarter. What we like under CEO Andy Jassy is the added focus on profits and margins that should allow Amazon to fund these investments while also delivering continued bottom-line growth. Our thinking is that, as consumers embrace digital shopping further and the adoption of AI and cloud continues, Amazon stands to reap the benefits of capex and cost/productivity investments in H2 2024 and 2025. We’ll be looking to see that payoff in further margin expansion at the retail-facing business and a pickup in AWS’s performance in the coming quarters. As investors, it’s that step function higher in profit growth that we want to participate in with AWS shares. AMZN is hovering at the 100-day moving average, which is tempting but if the shares trend lower toward the 200-day moving average near $198 and move into oversold territory that would offer a more compelling entry point.
1-Wk. Price Change: -2.0%; Yield: 0.0%
INVESTMENT THESIS: We believe the upside will result from Amazon's continued eCommerce dominance, AWS's continued leadership in the public cloud space, and ongoing growth of the company's advertising revenue stream, which feeds off Amazon's eCommerce business. Additionally, we think profitability will continue to improve as AWS and advertising account for a larger portion of total sales as both these segments sport higher margins than the eCommerce operation. While we believe the increasing share of the revenue from these higher margin businesses will be key to driving profitability longer-term, we think margins on eCommerce stand to improve as the company's infrastructure is further built out and economies of scale further kick in. The embedded call option is that management is always looking to enter a new space and generate new revenue streams.
Target Price: Reiterate $260; Rating: One
Panic Point: $190
RISKS: High valuation exposes the stock to volatile swings, eCommerce has exposure to slower consumer spending and competition, management is not afraid to invest heavily, potential headwinds resulting from new eCommerce regulation in India, and management is not scared to invest aggressively for growth, which can at times cause volatile reactions as near-term concerns arise relating to the impact on margins.
American Express AXP; $300.96; 385 shares; 2.35%; Sector: Financial Services
UPDATE: In late December, we added American Express (AXP) shares to the portfolio with a $330 price target — and the shares were a strong performer in January. Following the company’s December-quarter earnings report, we boosted our price target to $345 given prospects for greater margin leverage in the coming quarters as Amex targets slower operating expense growth compared to recent years. At the same time, the company plans to refresh 35-50 card products this year, which tend to drive membership levels as well as average fees per card higher. Management targets mid-high teens card fee growth year over year, which expands that steady base of fee-based profits. After the recent selloff in AXP shares that followed the February Consumer Confidence and Consumer Inflation Expectations data and quarterly results from Walmart but also strong travel spending comments from Booking.com, we added to the portfolio’s AXP position at $295.81 and lifted our rating to One from Two. Similar to how the membership business model sets Costco apart from other retailers, it sets Amex apart from other credit card companies. Two items we will be monitoring closely as they relate to this position are Amex’s 2025 card refresh efforts, which tend to include new benefits that foster membership growth and move up the company’s average fee per card. Second, prospects for tax cuts, which, if passed, would be positive for consumer and other spending. The next known catalyst for AXP shares will be upcoming consumer spending-related data and timing for the first quarterly payment for the company’s $0.82 per share dividend.
1-Wk. Price Change: 1.9%; Yield: 0.9%
INVESTMENT THESIS: American Express is a globally integrated, membership-driven payments company, providing customers with access to products, insights, and experiences that enrich lives and build business success. The company has four reportable operating segments: U.S. Consumer Services (USCS), Commercial Services (CS), International Card Services (ICS), and Global Merchant and Network Services (GMNS). American Express targets the premium consumer space by continuing to deliver membership benefits that span our customers’ everyday spending, borrowing, travel, and lifestyle needs, expanding its roster of business partners around the globe, and developing a range of experiences that attract high-spending customers. In 2024, the company’s net card fee revenue accounted for 65% of its pre-tax income, which we see providing a differentiated business model that should continue to grow as Amex wins new card members and drives its average fee per card higher.
Target Price: Reiterate $345; Rating: One
Panic Point: Reiterate $260
RISKS: Slowdown in consumer spending, competition, membership growth, merchant acceptance, lack of new product innovation.
Bank of America Corp. BAC; $46.10; 4,410 shares; 4.12%; Sector: Financial Services
UPDATE: January was a strong month for Bank of America (BAC) shares, but the stock gave back much of those gains over the last few weeks. Renewed concerns about the speed of the economy and consumer spending have overshadowed interest rates and mortgage rate declines. Adding to that, we learned Berkshire Hathaway continued to trim back its BAC exposure in Q4 2024 even though the shares remain a top holding in Warren Buffett’s stock portfolio. However, we would note that shares of other big banks, such as JPMorgan Chase, also moved lower in February. Coming into February, a the M&A pipeline and prospects for other investment banking business remained healthy. We continue to see the Trump administration and reduced regulation supporting the M&A market, but we recognize recent stock market volatility could be a near-term headwind for the IPO market. The recently upsized SailPoint (SAIL) IPO that priced at $23 and is currently trading above that level is a positive development. Next week, Moove Lubricants is expected to price a 25 million share initial public offering between $14.50-$14.50, and BofA is one of the lead underwriters. We will continue to follow upcoming IPO offerings and their pricing, especially those for higher profile expected offerings from Chime, Klarna, CoreWeave, and others. As the IPO market firms and positive momentum builds, we could see a stronger IPO market emerge and that would be a catalyst for us to revisit our BAC target. While we wait for that, we will continue to keep tabs on potential bank regulations as well as potential Trump tax cuts that could reinvigorate the economy and BofA’s commercial banking business.
1-Wk. Price Change: 2.9%; Yield: 2.3%
INVESTMENT THESIS: Bank of America is one of the world's leading financial institutions, serving individual consumers, small and middle-market businesses, and large corporations with a full range of banking, investing, asset management, and other financial and risk management products and services. The company provides unmatched convenience in the United States, serving approximately 67 million consumer and small business clients with approximately 3,900 retail financial centers, approximately 16,000 ATMs, and award-winning digital banking with approximately 56 million verified digital users. Bank of America is a global leader in wealth management, corporate and investment banking, and trading across a broad range of asset classes, serving corporations, governments, institutions, and individuals around the world. Bank of America offers industry-leading support to approximately 3 million small business households through a suite of innovative, easy-to-use online products and services. The company serves clients through operations across the United States, its territories, and approximately 35 countries. From a reporting perspective, the company's business breaks down as follows: Net Interest Income breakdown: Consumer Banking 57%, Global Banking 23%, Global Wealth & Investment Management 14%, and Global Markets 6%; Income Before Tax breakdown: Consumer Banking 42%, Global Banking 27%, Global Wealth & Investment Management 16%, and Global Markets 15%. Bank of America pays a quarterly dividend of $0.22 per share.
Target Price: $53; Rating: One
Panic Point: $39
RISKS: Financial markets, fiscal, monetary, and regulatory policies, economic conditions, and credit ratings.
Eaton Corp. ETN; $293.32; 605 shares; 3.59%; Sector: Industrials
UPDATE: Following a double-digit gain in January, Eaton (ETN) followed the market lower in February leading the shares to be a drag on the portfolio. That decline came despite Big Tech data center spending rising significantly year over year in 2025. Through the end of 2024, the number of mega projects announced reached 569 with a cumulative value of $1.7 trillion. Backlog levels for those projects stand at $1.9 trillion, up 33% year over year. As impressive as those figures are, only 15% of those projects have started and expectations are a record number of starts will occur this year. Late in the month, a report that Microsoft may be dialing back its data center expansion plans led ETN shares to move into oversold territory. Microsoft defended its $80 billion spending plan, but we expect the topic will be a big one when Microsoft’s CFO presents at the Morgan Stanley TMT conference on March 4. At the same time, we should also consider the incremental spending by Trump’s Stargate project and keep our focus on total data center spending rather than marginal shifts in company spending. That speculative report pushed ETN shares into oversold territory in late February. We used that as well as earnings reports that show rising capital spending plans from electric utilities to pick up additional ETN shares and lift our rating to a One from Two. Closing out the month, Eaton announced an 11% increase to its quarterly dividend to $1.04 per share with the first payment coming on March 28 to shareholders of record as of March 10.
1-Wk. Price Change: -1.4%; Yield: 1.3%
INVESTMENT THESIS: Eaton is an intelligent power management company that makes products for data center, utility, industrial, commercial, machine building, residential, aerospace, and mobility markets. That business is positioned to capitalize on the megatrends of electrification, energy transition, and digitalization. We see Eaton helping address the power pain point created by data center, EV charging infrastructure, and other drivers of electricity demand. Research estimates that data center power demand will grow 160% by 2030, accounting for 3%-4% of global power up from 1%-2% today. Data centers will use 8% of U.S. power by 2030, compared with 3% in 2022.
Target Price: Reiterate $400; Rating: One
Panic Point: $275
RISKS: Raw material costs, labor costs, end market volatility, government legislation.
Elastic N.V. ESTC; $116.36; 1,712 shares; 4.04%; Sector: Consumer Cyclical
UPDATE: While shares of Elastic NV (ESTC) had a bump ride in February, the beat and raise January-quarter earnings report led them to finish the month on a high note. Combined with their January gains, ESTC shares finished the first two months of 2025 up mid-teen double digits, making them a strong force in the portfolio. Reviewing the company’s earnings report, the drivers behind the quarter’s performance and improved outlook tie back to continued customer and subscription revenue growth mixed with growing operating leverage. Elastic’s results also confirm the growing adoption of AI in enterprises and that combination led us to nudge our price target to $140. In that alert, we shared our thinking as to why Elastic’s guidance for the current quarter is likely to prove conservative. Given the post-earnings pop in the shares, our message to folks who have missed out on them is to not chase them but rather wait for them to settle out. We have a big week of economic data next week that, if it reaffirms what we saw in the February Flash PMI data, could spook an already nervous market. Should that come to pass and we see ESTC shares give back some of their post-earnings gains, that would be a more opportune time to add some shares.
1-Wk. Price Change: 9.4%; Yield: 0.0%
INVESTMENT THESIS: As digital transformation drives mission-critical business functions to the cloud, Elastic N.V. brings the portfolio exposure to search AI adoption across IT and enterprise business lines as companies look to drive productivity. Elastic bills itself as the Search AI company and its Elastic Search AI Platform as a hosted, managed service across major cloud providers, including Amazon Web Services (AWS), Google Cloud, and Microsoft’s Azure in more than 55 public cloud regions globally. Customers can also deploy Elastic’s platform across hybrid clouds, public or private clouds, and multi-cloud environments. What we like even more about this is Elastic’s subscription-based business model, which accounts for just over 93% of its total revenue stream. As we’ve discussed before with other companies, this affords not only good visibility but also predictable cash flow and earnings. Moreover, the gross margins associated with the subscription business are above 80%, which helps explain the rising margin profile and EPS as that business has come to account for a greater percentage of overall revenue. When it comes to potential risks, one sign that would lead us to reconsider owning the shares would be if either Elastic’s customer count or its subscription revenue per customer stalled. Another item we’ll be watching because of Elastic’s geographic mix, with 40% of its revenue outside of the U.S., is the dollar and its corresponding foreign exchange impact.
Target Price: Reiterate $140; Rating: One
Panic Point: $90
RISKS: Enterprise software spending, AI adoption, competitive dynamics, foreign exchange risk.
Nvidia Corp. NVDA; $124.92; 1,535 shares; 3.88%; Sector: Technology
UPDATE: Nvidia (NVDA) shares were volatile in February following DeepSeek-related headlines and speculation, since refuted, that Microsoft may slow its capital spending plans. Despite those headlines, the revenue-limiting cloud capacity constraints at Microsoft, Amazon, Meta, and Alphabet are being addressed, supporting the strong January-quarter data center growth posted by Nvidia. While Nvidia’s top-line guidance for the current quarter was above market forecasts, the accelerated ramp for its Blackwell solutions is dinging near-term gross margin prospects. As we explained in our Alert, as production matures, Nvidia’s management expects those margins will return to the mid-70s “later this year,” which means that, in the near term, meeting consumer demand trumps cost improvement efforts. Ramping to meet demand isn’t easy under normal conditions but when there is a sea change underway that drives explosive demand, it’s even more challenging. If it sounds like we’re inclined to give Nvidia a pass, we are, but only because of rising AI adoption levels and capital spending to expand the digital infrastructure to support it. We continue to think rising AI adoption across consumers, enterprises, and other institutions (including local, state, and federal governments), driving productivity and other efficiencies, means we have a multi-year explosion of digital content creation and consumption ahead of us that will pressure data center and network capacity. While the selloff this week may tempt folks to pick up some shares, they have passed through all three key support levels. That means with the fundamental picture a known known, we will look for an improvement in the technical setup before making a move with the shares. Should NVDA become oversold, that would be a reason to become more aggressive with the shares. We will also continue to monitor AI adoption trends as well as monthly data points from Taiwan Semi, Hon Hai, and other company comments.
1-Wk. Price Change: -7.1%; Yield: 0.0%
INVESTMENT THESIS: Nvidia is well positioned to benefit from ramping AI and data center spending. The company pioneered accelerated computing to help solve the most challenging computational problems. Nvidia is now a full-stack computing infrastructure company with data-center-scale offerings that are reshaping the industry. The company's full stack includes the foundational CUDA programming model that runs on all Nvidia GPUs, as well as hundreds of domain-specific software libraries, software development kits, or SDKs, and Application Programming Interfaces, or APIs. This deep and broad software stack accelerates the performance and eases the deployment of Nvidia accelerated computing for computationally intensive workloads such as artificial intelligence, model training and inference, data analytics, scientific computing, and 3D graphics, with vertical-specific optimizations to address industries ranging from healthcare and telecom to automotive and manufacturing. Nvidia reports in two business segments: Compute & Networking and Graphics. The Compute & Networking segment (78% of revenue, 85% of operating income) is comprised of Data Center accelerated computing platforms and end-to-end networking platforms, including Quantum for InfiniBand and Spectrum for Ethernet; NVIDIA DRIVE automated-driving platform and automotive development agreements; Jetson robotics and other embedded platforms; Nvidia AI Enterprise and other software; and DGX Cloud software and services. The Graphics segment (22% of revenue, 15% of operating income) includes GeForce GPUs for gaming and PCs, the GeForce NOW game streaming service and related infrastructure; Quadro/NVIDIA RTX GPUs for enterprise workstation graphics; virtual GPU, or vGPU, software for cloud-based visual and virtual computing; automotive platforms for infotainment systems; and Omniverse Enterprise software for building and operating metaverse and 3D internet applications.
Target Price: $175; Rating One
Panic Point: $101
RISKS: Market and interest rate risk, credit risk, country risk, and operational risk, including cybersecurity.
Qualcomm Inc. QCOM; $157.17; 1,200 shares; 3.82%; Sector: Technology
UPDATE: Qualcomm (QCOM) shares are modestly positive year to date as earlier gains tied to improving prospects for 2025 smartphone shipments and ramp in the AI PC market were overshadowed by the geopolitical tensions, tariffs, and other factors that weighed on the tech sector this week. For 2025, Canalys sees the rebound in the PC market continuing in part as businesses prepare for the end of Windows 10, and for wider refresh efforts as more AI-PC models hit the market. Canalys sees AI-PCs accounting for 35% of the PC market this year, up from around 20% last year. On its earnings call this week, Dell confirmed there are a number of new AI PC models coming between now and the end of H1 2025. On its earnings call, HP revealed the AI PC market experienced remarkable momentum, achieving a sequential growth rate of 25% in Q4 2024. Korean memory company SK Hynix expects AI PC penetration to reach 30%-40% of all PC shipments this year. SK also sees the smartphone market growing by a low-to mid-single-digit percentage this year, but it also sees AI fostering the replacement cycle with those enabled models accounting for 30% of shipments this year. We continue to see progress in the AI PC and automotive markets leading Wall Street to revisit how it values QCOM and that is what we are aiming to capture by owning the shares. Upcoming catalysts we’ll be watching include February monthly revenue reports from Taiwan Semi and Foxconn and the upcoming Mobile World Congress event that runs next week. We will continue to keep close tabs on QCOM shares, which, as we close out February, are approaching oversold territory, based on their RSI levels.
1-Wk. Price Change: -5.0%; Yield: 2.2%
INVESTMENT THESIS: Qualcomm focuses on foundational technologies for the wireless industry, including 3G (third generation), 4G (fourth generation), and 5G (fifth generation) wireless technologies and processor technologies including high-performance, low-power computing, and on-device artificial intelligence technologies. As a connected processor company, its technology roadmap aims to enable the connected intelligent edge (the next generation of smart devices) across industries and applications beyond handsets, including automotive and the Internet of Things (IoT). Qualcomm has three reportable segments: QCT (Qualcomm CDMA Technologies) semiconductor business, which develops and supplies integrated circuits and system software based on 3G/4G/5G and other technologies for use in mobile devices; automotive systems for connectivity, digital cockpit, and ADAS/AD; and IoT including consumer electronic devices; industrial devices; and edge networking products. QCT accounts for 80%-85% of revenue. QTL (Qualcomm Technology Licensing) licensing business grants licenses or otherwise provides rights to use portions of the company's intellectual property portfolio, which includes certain patent rights essential to and/or useful in the manufacture and sale of certain wireless products. QTL accounts for ~15% of Qualcomm's revenue but contributes a greater portion of the company's operating income.
Target Price: $200; Rating: One
Panic Point: $140
RISKS: Customer risk, technology advancement, competition risk, third-party supplier, and manufacturing partner risk.
ServiceNow NOW; $929.76; 198 shares; 3.73%; Sector: Technology
UPDATE: In late January, we boosted our ServiceNow (NOW) price target to $1,250 from $1,200 following the company’s December-quarter earnings report and guidance that points to further margin expansion on top of expected 20% top-line growth. That signaled greater AI uptake across ServiceNow’s offering by its expanding customer base. While the management team rattled off some impressive metrics for customer wins on the earnings call, we are far more impressed with the 18% year-over-year increase in total deferred revenue coming into 2025 and the visibility that brings. As the shares moved lower in mid-February, on the back of a favorable report about corporate AI spending from McKinsey, we added to the portfolio’s NOW position. Toward the end of the month, we scooped more shares of ServiceNow near $942 as the stock was oversold despite the growing number of signals and other data points for continued cloud adoption and growing AI adoption. Recent and upcoming signals point to Walmart, Carvana, Booking.com, McDonald’s, and others utilizing AI to enhance productivity and the consumer experience. To that, we can also add the very bullish comments about AI adoption made during Workday’s earnings call this week. As we made that latest NOW purchase, we also upgraded them to a One rating and adjusted our panic point to $850.
1-Wk. Price Change: -0.9%; Yield: 0.0%
INVESTMENT THESIS: The addition of ServiceNow adds exposure to the enterprise as it deploys AI-enabled solutions across its enterprise workflow platform. The company’s “Now Platform” is a cloud-based solution with embedded AI and machine learning (ML) capabilities that help unify and digitize workflows, driving productivity. At the heart of it, the company’s platform automates workflows across an entire enterprise by connecting disparate departments, systems, and silos in a seamless way to unlock productivity. ServiceNow counts more than 8,100 global customers, including 85% of the Fortune 500, with 97% of its revenue from subscriptions that have notched a 98% renewal rate.
Target Price: Reiterate $1,250; Rating: One
Panic Point: $850
RISKS: Industry and economic risk, competition and competitive pressures, and acquisition risk.
United Rentals URI; $642.32; 240 shares; 3.12%; Sector: Industrials
UPDATE: We continued to rebuild the portfolio’s position in United Rentals (URI), taking advantage of the mid-January market pullback and oversold condition in the shares to do so. The stock rebounded in the second half of January but gave back those gains amid sticky inflation data in February that prompted Fed Chair Powell to comment the Fed has more work to do. That called into question 2025 housing market prospects as did weaker-than-expected guidance from Toll Brothers, Builders FirstSource, and others that serve the housing market. That and United Rentals calling off its planned acquisition of H&E Equipment led to price target re-jiggering for URI shares. Because we did not bake the H&E acquisition into our expectations, we did not need to make any adjustments to our $900 target. We continue to see URI’s business benefiting from non-residential construction projects, including the $154 billion in mega projects announced in Q4 2024. Through the end of 2024, the number of mega projects announced reached 569 with a cumulative value of $1.7 trillion. Backlog levels for those projects stand at $1.9 trillion up 33% year over year. As impressive as those figures are, only 15% of those projects have started and expectations are a record number of starts will occur this year. That keeps us bullish on URI’s prospects and the shares. With the shares currently oversold, we are evaluating prospects to add further to the position and what we see in the January Construction Spending report could give us a reason to do so.
1-Wk. Price Change: -2.3%; Yield: 1.0%
INVESTMENT THESIS: United Rentals, the largest equipment rental company in the world, operates throughout the United States and Canada, and has a limited presence in Europe, Australia, and New Zealand. It serves industrial and other non-construction; commercial (or private non-residential) construction; and residential construction. Industrial and other non-construction rentals represented approximately 50% of rental revenue, primarily reflecting rentals to manufacturers, energy companies, chemical companies, paper mills, railroads, shipbuilders, utilities, retailers, and infrastructure entities; commercial construction rentals represented approximately 46% of rental revenue, primarily reflecting rentals related to the construction and remodeling of facilities for office space, lodging, healthcare, entertainment, and other commercial purposes; and residential rentals around 4% of revenue. We see the company benefiting on three fronts — the seasonal uptick in construction spending; the release of funds and projects associated with the five-year Biden Infrastructure bill; and the company's nip-and-tuck acquisition strategy that should further enhance its geographic footprint.
Target Price: Reiterate $900; Rating: One
Panic Point: $650
RISKS: Industry and economic risk, competition and competitive pressures, and acquisition risk.
Universal Display OLED; $153.62; 1,290 shares; 4.01%; Sector: Technology
UPDATE: After finishing January modestly higher, shares of Universal Display trended lower during the first half of February despite a number of positive data points. These included rising display manufacturing equipment sales from Applied Materials, organic light emitting diode display capacity additions at LG Display (LG), Apple completing its iPhone transition to organic light emitting diode displays, and growing penetration of that display technology in notebook PCs, tablets and other end markets. Following consensus-topping December-quarter results that sparked a rebound in the shares, we adjusted our OLED price target to $200 from $250 even though the company’s outlook continues to be, in our view, conservative. We laid out our logic behind that reasoning in our earnings Alert. How conservative Universal Display’s 2025 revenue forecast is will be determined by what we see in the coming months, but it’s hard to see how its revenue growth would decelerate from the 12% posted in 2024. Catalysts we’ll be watching will be new model introductions from smartphone and other vendors at Mobile Word Congress between March 3-6, as well as other new product announcements for models that will ship later this year. Universal Display announced a first-quarter 2025 cash dividend of $0.45 per share, payable on March 31 to shareholders of record as of the close of business on March 17. As we revised our price target for Universal Display, so too did others across Wall Street. TD Cowen reduced its to $200 from $225, while Roth MKM boosted its to $213 from $207.
1-Wk. Price Change: -2.3%; Yield: 1.0%
INVESTMENT THESIS: Universal Display focuses on the development and commercialization of organic light-emitting diode (OLED) technologies and materials for use in display and solid-state lighting applications. OLED displays are capturing a growing share of the display market, especially in the mobile phone, television, monitor, wearable, tablet, notebook, personal computer, augmented reality (AR), virtual reality (VR), and automotive markets. This adoption reflects advantages over competing display technologies concerning power efficiency, contrast ratio, viewing angle, video response time, form factor, and manufacturing cost. Universal Display's business strategy is to develop new OLED materials and sell existing and new materials to product manufacturers for display applications, such as mobile phones, televisions, monitors, wearables, tablets, portable media devices, notebook computers, personal computers, and automotive applications, and specialty and general lighting products. The company also looks to license its OLED material, device design, and manufacturing technologies to those manufacturers. As such, Universal Display has a significant portfolio of proprietary OLED technologies and materials with more than 5,500 patents issued and pending worldwide.
Target Price: Reiterate $200; Rating: One
Panic Point: $135
RISKS: Patent and Intellectual property protection; maintaining OLED manufacturing and customer relationships; technology risk; market risk.
Vulcan Materials Company VMC; $247.31; 613 shares; 3.07%; Sector: Building Materials
UPDATE: After climbing nearly 8% in January, like other construction and interest rate-sensitive stocks, Vulcan Materials (VMC) moved lower in February despite strong prospects for cement and aggregate volumes as well as pricing in the coming quarters. During the December quarter, Vulcan reported nice margin expansion that was traced back to favorable pricing dynamics reflected in the double-digit improvement in freight-adjusted sales price per ton and gross profit per ton in the December quarter. For the coming year, Vulcan sees a third consecutive year of double-digit year-over-year growth in the Aggregates segment, cash gross profit, and a more substantial increase in the Total Asphalt and Concrete segments, cash gross profit. We see that translating into further margin expansion and EPS growth. At the same time, volumes are also expected to rise due to the matriculation of construction mega projects as well as prospects for public highway, pavement, and street construction grow 8% in 2025 to $128.4 billion. On the earnings call, management also conceded that January and February winter weather means this year is off to a slow start, but let’s remember the bulk of Vulcan’s sales and profits are generated in the June and September quarters. This means the likely catalyst to drive VMC shares meaningfully higher will emerge as we move past the winter season, and that means either the March or April Construction Spending Report. In the meantime, we’ll continue to monitor other indicators of non-residential construction activity. While the current share price offers ample upside to our $310 target and supports our One rating, given the portfolio’s position size we’d be more inclined to add additional VMC shares if they became oversold. The next known catalysts for VMC shares will be next week’s January Construction Spending Report and Construction Partners (ROAD) presentation at the 46th Annual Raymond James Institutional Investor Conference. Vulcan will pay its next quarterly dividend of $0.49 per share on March 24 to shareholders of record on March 10.
1-Wk. Price Change: -2.2%; Yield: 0.7%
INVESTMENT THESIS: Vulcan Materials operates primarily in the U.S. and is the nation's largest supplier of construction aggregates (primarily crushed stone, sand, and gravel), a major producer of asphalt mix and ready-mixed concrete, and a supplier of construction paving services. Its products are the indispensable materials used in building homes, offices, places of worship, schools, hospitals, and factories, as well as vital infrastructure including highways, bridges, roads, ports and harbors, water systems, campuses, dams, airports, and rail networks. Ramping spending associated with the Biden Infrastructure Law should drive demand for Vulcan's products over the coming years. Vulcan has historically complemented its organic growth prospects by acquiring businesses to expand its geographic reach and product scope. Since 2014, the company has acquired more than two dozen companies, including the 2021 acquisition of U.S. Concrete. That combination has allowed the company to deliver steady top and bottom-line growth over the last decade, with only a modest decline when the pandemic hit in 2020.
Target Price: Reiterate $310; Rating: One
Panic Point: $225
RISKS: General economic and business conditions; dependence on the construction industry; timing of federal, state, and local funding for infrastructure; changes in the level of spending for private residential and private nonresidential construction.
TWOS
Apple AAPL ; $241.84; 790 shares; 3.86%; Sector: Technology
UPDATE: Apple (AAPL) shares rebounded in February, but so far remain a modest drag on the portfolio’s year-to-date performance. With the upgrade cycle unfolding and the higher-margin Services business poised to become a larger part of the business mix, our AAPL price target remains $270. As we look to gauge Apple’s guidance, we will be closely watching comments and monthly revenue reports from Taiwan Semiconductor and Foxconn as well as investor conference comments from others in the connected device food chain. The recent refresh of Apple’s lower-end iPhone to the iPhone 16E model brings Apple Intelligence to that class of devices. Apple is also expected to bring Apple Intelligence to the European Union in April and is working with Alibaba and Baidu to bring similar features to China. That rollout as well as further Apple Intelligence updates in coming iOS updates are other potential catalysts on our watch list. The portfolio’s position in AAPL is a meaningful one and that means we will need to be selective when it comes to adding additional shares. That’s another reason for us to pay close attention to upcoming smartphone and upgrade-related data. At the same time, should we see market weakness pull Apple shares back near the $225 level that would offer us a favorable risk-to-reward trade-off in the shares. Subject to the driver behind such a move, it could also give us enough to revisit our Two rating.
1-Wk. Price Change: -1.5%; Yield: 0.4%
INVESTMENT THESIS: While we acknowledge that near-to-midterm performance remains heavily influenced by iPhone sales, the dynamic is shifting as investors finally place greater emphasis on Services growth. We are bullish on the 5G upgrade cycle and believe longer-term upside will continue to come as Services revenue grows its share of overall sales. Services provide for a recurring revenue stream at higher margins, a factor that serves to reduce earnings volatility while allowing for a higher percentage of sales to fall to the bottom line; as a result, we believe that Services growth and the installed base, are much more important than how many devices the company can sell in each 90-day period. In addition to improved profitability, we also believe the transparent nature of this revenue stream will demand an expanded price-to-earnings multiple as segment sales grow. Furthermore, we believe that Apple's desire to push deeper into the healthcare arena will help make its devices invaluable as more life-changing features are added and the company works to democratize health records. Lastly, also see upside resulting from increased adoption of wearables (think the Apple Watch) and potential new product announcements such as an AR/VR headset or an update on Project Titan, the company's secretive autonomous driving program.
Target Price: Reiterate $270; Rating: Two
Panic Point: Reiterate $200
RISKS: Slowdown in consumer spending, competition, lack of new product innovation, elongated replacement cycles, failure to execute on Services growth initiative.
Applied Materials Inc. AMAT; $158.07; 970 shares; 3.11%; Sector: Semiconductor Manufacturing
UPDATE: This past week was a challenging one for Applied Materials (AMAT) shares as it took them from a net positive for the portfolio to being a drag on its year-to-date performance. We attribute that to the overall move lower in the market and the pronounced fall in the Nasdaq Composite this week. Export controls on China led Applied to deliver modestly weaker-than-expected revenue guidance for the current quarter, and that led us to trim our price target to $205 from $210. However, we continue to see the AI and data center spending ramp and growing AI adoption in other devices driving demand for new semi-cap equipment in the coming quarters and next few years. That should translate into a re-acceleration of growth inside Applied. That view was shared by Lam Research, which held its first analyst day in five years in late February. Lam went on to back industry forecasts calling for the chip industry to hit $1 trillion in size in the next several years, primarily due to AI, data center, IoT, and the growing array of connected devices. For context, that’s compared to $627.6 billion in 2024, and while we don’t necessarily pinpoint $1 trillion by 2030, it’s hard to argue with the direction. With the shares approaching oversold, we are evaluating potential entry points and our Two rating.
1-Wk. Price Change: -8.1%; Yield: 1.0%
INVESTMENT THESIS: Applied provides manufacturing equipment, services, and software to the semiconductor, display, and related industries. With its diverse technology capabilities, Applied delivers products and services that improve device performance, power, yield, and cost. Applied's customers include manufacturers of semiconductor chips, liquid crystal, and organic light-emitting diode displays, and other electronic devices. Applied operates in three reportable segments: Semiconductor Systems (73% of 2024 revenue, 79% of 2024 operating income), Applied Global Services (23%, 20%), and Display and Adjacent Markets (4%, 1%). Key customers include Samsung (12% of 2024 sales), Taiwan Semiconductor (11%), and Intel (less than 10%).
Target Price: Reiterate $205; Rating: Two
Panic Point: $160
RISKS: Manufacturing and supply chain, competitive factors, government regulation, technology change.
Axon Enterprise AXON; $528.45; 100 shares; 1.07%; Sector: Aerospace & Defense
UPDATE: Following a 30% drop in the span of a few days that landed them in oversold territory, we called up Axon Enterprise (AXON) shares from the Bullpen initiating a small position ahead of the company’s earnings report. As we did this we established a Two rating with a $600 price target and a $425 panic point. After the company’s December-quarter earnings report confirmed our thesis behind the positive impact on company margins as Software & Services becomes a larger part of the revenue mix, we lifted our price target to $625 and boosted our panic point to $480. When we look at the company’s outlook for 2025, revenue guidance of $2.55 billion to 2.65 billion, up around 25% year over year, is above the $2.56 billion market forecast. However, we would argue, its adjusted earnings before interest, taxes, depreciation, and amortization guidance is the item to focus on. Management sees that hitting $640 million to $670 million, which implies margins of 24%-26% compared to 25% achieved in 2024. Here’s the thing, as the Software & Services business has grown from just under 33% of Axon’s total revenue in 2022 to just over 41% in 2024, its adjusted EBITDA margins have risen to 25.0% last year from 19.5% in 2022. This suggests that as the Software & Services segment continues to become a larger piece of the revenue pie from 42.6% in 2024, management’s adjusted EBITDA margin guidance is likely to prove conservative. Axon management will be presenting at the Morgan Stanley TMT conference on Monday, March 3, and we expect an upbeat presentation. We will be listening for insights about international services revenue prospects and more comments relating to Axon’s drone and AI prospects.
1-Wk. Price Change: 6.5%; Yield: 0.0%
INVESTMENT THESIS: Axon Enterprise develops, manufactures, and sells conducted energy devices and cloud-based digital evidence management software designed for use by law enforcement, corrections, military forces, private security personnel, and private individuals for personal defense. The company operates in two segments: Taser (recently renamed Connected Devices) and Software & Sensors (recently renamed Software & Services). Taser develops and sells CEDs used for protecting users and virtual reality training. Software & Sensors manufactures fully integrated hardware and cloud-based software solutions such as body cameras, automated license plate reading, and digital evidence management systems. Axon delivers its products worldwide and gets most of its revenue from the United States. President Biden's fiscal year 2023 budget requested a fully paid-for new investment of approximately $35 billion to support law enforcement and crime prevention — in addition to a $2 billion discretionary request for these same programs. According to Mordor Intelligence, the wearable, and body-worn cameras market on its own was valued at $1.62 billion in 2020 and is expected to reach $424.63 billion by 2026.
Target Price: Reiterate $625; Rating: Two
Panic Point: $425
RISKS: Manufacturing and supply chain, competitive factors, government regulation, technology change.
Costco Wholesale COST; $1,048.61; 187 shares; 3.97%; Sector: Consumer Staples
UPDATE: Quarter to date, Costco (COST) shares are up mid-double digits, which we attribute to the company’s wallet share-winning January comp sales figures and renewed consumer concerns for inflation. Mid-February when COST shares were overbought we locked in a slice of triple-digit gains on the position. A recent Bank of America survey found that nearly half of Americans at least somewhat agree with the statement, “I am living paycheck to paycheck” and we see that powering further share gains as Costo continues to expand its warehouse footprint and flex its digital commerce platforms. The next catalyst for Costco will be its February sales report and its quarterly earnings report on March 6. That report should start to show the phased impact of Costco’s 2024 membership fee increase, and we look forward to an update on the company’s quarter-end warehouse count and its comments about potential tariff impacts. Based on what we learn, we will revisit our current price target as needed.
1-Wk. Price Change: 1.3%; Yield: 0.4%
INVESTMENT THESIS: We like Costco's long-term prospects, driven by a club-based operating model that focuses on volumes, not margins, and therefore offers its customers a value proposition of everyday low prices. The strength of this model has created an incredibly loyal customer base with low churn and continued share gains in both bricks-and-mortar and e-commerce. This is a global concept, evidenced by the strength of sales both in the U.S. and abroad, which includes an emerging China opportunity. We see the company's membership model as a key differentiator vs. other retailers and its plans to open additional warehouse locations in the coming quarters should drive retail volumes and the higher-margin membership fee income as well. We also appreciate management's approach to capital returns and their willingness to return cash when it is in excess on the balance sheet.
Target Price: Reiterate $1,100. Rating: Two
Panic Point: $850
RISKS: Inability to pass through higher costs, fuel prices, weaker consumer, and membership churn.
Dutch Bros BROS; $79.16; 1,890 shares; 3.03%; Sector: Consumer Cyclical
UPDATE: Shares of Dutch Bros (BROS) continued their ascent in January fueled by a fresh round of price and ratings increases from Baird, Barclays, Stifel, and Jefferies, but in response to the company’s wonderful December-quarter earnings report we boosted our price target to $85 from $65. The rationale behind that increase was better-than-expected same-store sale growth and margins, with prospects for more of the same as the company’s expansion plan continues. As we lifted our price target, prudent portfolio management led us to take some BROS chips off the table, locking in a triple-digit gain on that slug. The market’s late February selloff erased some of the upward move in BROS shares, but with less than 10% upside to our target, we’d be more interested in adding additional shares at lower prices. The next known catalyst for the share will be the company’s March 27 Investor Day, which should expand on its food menu efforts and bring an update on its footprint expansion plans.
1-Wk. Price Change: 4.0%; Yield: 0.0%
INVESTMENT THESIS: Dutch Bros is an operator and franchisor of drive-thru shops that focus on serving high-quality, hand-crafted beverages with unparalleled speed and superior service. As of June 30, 2024, there were 912 shops in operation in 18 U.S. states, of which 612 were company-operated and 300 were franchised. Coffee-based beverages make up ~50% of the menu mix, and ~25% of the menu mix is based upon the company’s proprietary Blue Rebel energy drink, which is highly customizable with flavors and modifiers and can be served blended or over ice. The energy platform helps unlock the afternoon daypart and broadens the company’s appeal. The remaining 25% of the menu mix is a wide variety of teas, lemonades, sodas, and smoothies. Through the first half of 2024, Dutch Bros opened 81 shops and targets 150-165 new ones for all of 2024. The company’s west-to-east expansion is a time-tested strategy that should drive revenue and EPS growth over the next several years. Over the last week, Citi and Jefferies boosted their ETN price targets to $440.
Target Price: Reiterate $85; Rating: Two
Panic Point: $42
RISKS: Commodity risks, labor costs, interest rate risk, inflation.
First Trust Nasdaq Cybersecurity ETF CIBR; $66.11; 2,188 shares; 2.93%; Sector: Cybersecurity
UPDATE: Each time we note ripped-from-the-headlines confirmation points for the portfolio and its underlying strategy, one constant is the signals for cybersecurity demand. That explains the net positive movement in the shares during the first two months of 2025. When the shares of this ETF were bumping up against overbought levels earlier this month, we rang the register and locked in a slice of impressive gains for this holding. Artificial intelligence will super-charge familiar 2024 threats in 2025, putting new wrinkles on old security challenges such as phishing, insider threats, and ransomware. Research firm Gartner expects that cybersecurity spending will increase 15% in 2025, from $183.9 billion to $212 billion. We continue to favor the diversified exposure CIBR brings to the portfolio, which complements the cybersecurity efforts at Elastic, Microsoft, and Alphabet. If we see CIBR shares bump up against and successfully test the 100-day moving average near $64.50, subject to what is happening in the overall market, that could be a nice place for folks to nibble on some shares.
1-Wk. Price Change: -2.3%; Yield: 0.0%
INVESTMENT THESIS: The First Trust Nasdaq Cybersecurity ETF seeks investment results that correspond generally to the price and yield (before the fund's fees and expenses) of an equity index called the Nasdaq CTA Cybersecurity Index. The Nasdaq CTA Cybersecurity Index is designed to track the performance of companies engaged in the cybersecurity segment of the technology and industrial sectors. It includes companies primarily involved in the building, implementation, and management of security protocols applied to private and public networks, computers, and mobile devices to protect the integrity of data and network operations. To be included in the index, a security must be listed on an index-eligible global stock exchange and classified as a cybersecurity company as determined by the Consumer Technology Association. Each security must have a worldwide market capitalization of $250 million, have a minimum three-month average daily dollar trading volume of $1 million, and have a minimum free float of 20%.
Target Price: Reiterate $72; Rating: Two
Panic Point: Reiterate $57
RISKS: Cybersecurity spending, technology, and product development, the timing of product sales cycle, new products, and services in response to rapid technological changes and market developments as well as evolving security threats.
Labcorp Holdings Inc. LH; $251.04; 710 shares; 3.61%; Sector: Healthcare
UPDATE: Despite a modest setback in February, shares of Labcorp (LH) remained a positive influence on the portfolio with their net gain during January and February. Following the company’s quarterly earnings report in early February, we boosted our price target to $265 from $260 primarily due to improving margin prospects. The company's top-line outlook breaks down into faster growth at the company’s larger and more profitable Diagnostics business (78% of sales), which is slated to be led once again by a mixture of organic and acquisition-led growth. We continue to see the company benefiting from the aging population as it continues to expand the battery of tests it offers and further expands its Diagnostics reach in hospitals, health systems, and regional labs. In 2024, the company inked 10 such transactions and expected free cash flow should allow for that to continue. Similar to how Costco’s expanding footprint helps drive future organic sales growth, we see the same for Labcorp as its reach expands. The chart shows the stock is right near highs, and recent strong price action vs the market is a huge positive. In fact, the stock had a streak of eight straight-up days after penetrating the 20-day moving average. Since then, the stock is up about 5% on strong volume. The MACD is turned up for a buy signal now, money flow is turning bullish, but the stock is not overbought yet. The all-time highs from back in late January are less than 2% away from current levels. Even after our price target bump, the potential upside of less than 10% makes it hard to argue for adding more shares at current levels. A pullback near the 50-day moving average at $237.30, or one to the 100-day moving average near $240 offers a much better risk-reward tradeoff.
1-Wk. Price Change: 0.5%; Yield: 1.1%
INVESTMENT THESIS: Labcorp is a global leader in innovative and comprehensive laboratory services that provides vital information to help doctors, hospitals, pharmaceutical companies, researchers, and patients make clear and confident decisions. By leveraging its diagnostics and drug development capabilities, the company provides insights and accelerates innovations to improve health and improve lives. The company is organized under two segments, consisting of Diagnostics Laboratories (Dx), which includes routine testing and specialty/esoteric testing, and Biopharma Laboratory Services (BLS), consisting of Early Development Research Laboratories and Central Laboratory Services. Our attraction to LH shares stems from the combination of the aging population driving diagnostic testing growth and the increasing array of diagnostic testing as well. That combination is expected to drive the healthcare testing services market to $12.6 billion by 2029, from $7.4 billion in 2024, according to Markets and Markets. To augment its position in oncology, women's health, autoimmune diseases, and neurology, the company has been expanding through acquisitions and partnerships with health systems and regional local labs.
Target Price: Reiterate $265; Rating: Two
Panic Point: Reiterate $200
RISKS: Macroeconomic factors, changes in healthcare reimbursement models and products, government regulations, product discontinuations or recalls.
Marvell Technology MRVL; $91.82; 1,867 shares; 3.47%; Sector: Technology
UPDATE: Over the last several weeks, we have received multiple reaffirming data points for AI adoption, data center capital spending, and improving demand for networking and carrier infrastructure. The latest was quarterly results from Nvidia and robust AI server shipment expectations from Dell this week. Despite what that means for Marvell (MRVL) when it reports its quarterly results next week, the shares were pulled dramatically lower with the tech selloff over the last few days. Our position has been that we are seeing an AI arms race unfold as companies and other institutions adopt AI and that will continue to drive capacity demands for AI and data center chips. We are starting to see a recovery in enterprise networking demand and carrier infrastructure. As enterprise and consumer AI adoption grows, we should see the rebound in those markets accelerate, a positive for Marvell. While not yet oversold, the more than 25% pullback in MRVL shares has them once again on our shopping list. Given our concerns about upcoming February data next week, we will tread cautiously, but if the shares become oversold based on their RSI level that could lead us to scoop more up for the portfolio.
1-Wk. Price Change: -11.5%; Yield: 0.3%
INVESTMENT THESIS: Marvell is a fabless supplier of high-performance standard and semi-custom infrastructure semiconductor solutions. These solutions power the data economy, enabling the data center, carrier infrastructure, enterprise networking, consumer, and automotive/industrial end markets. With roughly 75%-80% of Marvell's revenue stream tied to digital infrastructure, we see it continuing to benefit from rising content consumption and creation. Pointing to that rising demand that necessitates network densification and the build of digital infrastructure, Ericsson sees global monthly average usage per smartphone reach 46 gigabytes (GB) by the end of 2028 vs. 19 GB in 2023 and 15 GB in 2022.
Target Price: Reiterate $130; Rating: Two
Panic Point: $85
RISKS: Technology risk, customer risk, competition risk, reliance on manufacturing partners, and supply chain constraints.
Mastercard MA; $576.31; 230 shares; 2.69%; Sector: Info. Tech
UPDATE: Shares of Mastercard (MA) shrugged off the market’s move lower this week and for February as they added to their January gains. We have noted in the past the strong correlation between MA’s performance relative to a strong labor market. That has been the case for a few years now, so if the job market shows some cracks, we may know about it early just by observing Mastercard’s performance. So far, that is not the case as consumer spending remains robust. After a monster run in January, the stock has used February as a time to consolidate gains. We will be looking to see if a nice base forms in shares, setting up a potential move higher. Volume trends in January turned bullish, the price action is constructive, and the shares retain good support at the $550 level. However, MA shares are only slightly away from all-time highs set in late January, and if we see softening in the jobs market, consumer spending, or both we may be inclined to monetize at least some of the portfolio’s MA gains. We will also keep our eye on potential Trump tax cut developments recognizing such cuts are likely to drive consumer and business spending.
1-Wk. Price Change: 3.4%; Yield: 0.5%
INVESTMENT THESIS: Mastercard is a card network company that benefits from the secular shift away from cash transactions and toward card-based and electronic payments. On Covid-19 dynamics, we view MA as a "reopening" play and an economic recovery play within technology because its cross-border volumes fell sharply during the pandemic but will rebound as mobility increases and travel restrictions ease. Mastercard has more international exposure relative to Visa (V), making its growth outlook more susceptible to new travel restrictions. However, we view MA as the better long-term play as we are betting on that inevitable recovery.
Target Price: $600; Rating: Two
Panic Point: $470
RISKS: The recovery in cross-border transactions, regulation in the payments market, competition from other fintechs, and pricing pressures.
Meta Platforms META; $668.20; 212 shares; 2.87%; Sector: Communication Services
UPDATE: After steadily building up the portfolio’s position in Meta (META) during the last five months of 2024, in mid-February, we took advantage of the quarter-to-date move in the shares to lock in some hefty gains. Data from Group M, WPP’s media investment group, sees pure-play digital advertising remaining as the strongest channel and forecasts it will account for almost 73% of total advertising in 2025. That backdrop as well as Meta’s utilizing machine learning and AI to deliver enhanced advertising programs across its Family of Apps bodes well for higher ad prices as companies look to reach Meta’s expanding base of users. Following the company’s consensus-beating December-quarter results that contained 20% top-line growth and continued margin expansion, we boosted our META price target to $725. As we noted in that Alert, however, META shares are in overbought territory and that was a factor in maintaining our Two rating. Meta clearly telegraphed an ambitious generative AI roadmap for this year, which could restrain the degree of margin improvement we see in the near term. That includes the management team reiterating it will spend $60 billion to $65 billion in capex this year, making it another year of investment. This could result in another step function step-up in margins once the company emerges from this spending ramp. In late February, it was reported Meta will seek to raise as much as $35 billion to help develop data centers in the U.S. We continue to see the company well positioned as the shift to digital advertising accelerates and as it focuses on monetizing more of its platforms. The recent pullback offers less than 10% upside to our current price target, and we would be more inclined to consider adding back shares closer to the 100-day moving average near $617. We’ll revisit our $725 target based on Meta’s monetization efforts and as its spending outlook is updated in the coming quarters. And be sure to mark your calendars, Meta will be paying its new $0.52 per share per quarter dividend, a 5% increase, on March 26 to shareholders of record on March 14.
1-Wk. Price Change: -2.2%; Yield: 0.3%
INVESTMENT THESIS: Meta segments its business between Family of App Products, which includes Facebook, Instagram, Messenger, Threads, and WhatsApp, and Reality Labs Products, which includes its metaverse and investments and future product R&D. Family of Apps accounts for ~99% of company revenue and 100% of company operating profit. Substantially all of Meta’s revenue is currently generated from advertising on Facebook and Instagram. Family daily active people (DAP) was 3.27 billion on average for June 2024, an increase of 7% year-over-year. Meta forecasts capital expenditures of approximately $37 billion to $40 billion in 2024 and expects its capital expenditures to grow significantly in 2025 to support our AI research and product development efforts. Meta is positioned to benefit from the ongoing shift toward digital advertising and the adoption of AI across its product offerings. We recognize Meta is ramping up capital spending as part of the current AI arms race, but we see that as an investment that should drive productivity in its core advertising business. As the company harvests that investment, we could see a step up in margins much like we saw in 2023.
Target Price: Reiterate $725; Rating: Two
Panic Point: $475
RISKS: Ability to add and retain users and user engagement; marketing spend; new products or changes to existing ones; competitive risk, geopolitical risk.
Microsoft Corp. MSFT; $396.99; 425 shares; 3.42%; Sector: Technology
UPDATE: The tech selloff weighed heavily on Microsoft (MSFT) shares this week, adding to their overall decline so far this year. That cumulative move has MSFT shares walking a path similar to what we saw in late July and early August of last year. Much like then should we see the shares move into oversold territory, we may opt to pick up some additional ones for the portfolio. Back in September, Microsoft shared its cloud business was capacity-constrained, prompting a ramp in capital spending to bring more capacity online. Even so, Microsoft delivered 31% revenue growth at Azure when it reported its December quarter. While some were miffed at that figure, it was only at the lower end of the company’s 31%-32% guidance. Microsoft expects to match December-quarter spending levels in each of the next two quarters as it continues to bring more cloud capacity online and targets even higher spending in H2 2025 and H1 2026 to meet customer demand for AI and cloud. Supporting that outlook, Microsoft said its AI business annual revenue run rate surpassed $13 billion and was above expectations. Commercial bookings increased 67% and 75% in constant currency and its Commercial remaining performance obligation increased to $298 billion, up 34%. Roughly 40% will be recognized in revenue in the next 12 months, up 21% year over year, while the remaining portion recognized beyond the next 12 months increased 45%. Because converting bookings into a faster pace of revenue growth hinges on Microsoft’s firing up new cloud capacity, our plan is to revisit the company’s capacity ramp when CFO Amy Hood presents at the Morgan Stanley TMT Conference on March 4. Our thought is that as capacity comes online the re-energized revenue stream is a potential catalyst for MSFT shares.
1-Wk. Price Change: -2.7%; Yield: 0.8%
INVESTMENT THESIS: We believe the cloud to be a secular growth trend and that the upside to the shares will result from Microsoft's hybrid cloud leadership as the company grabs market share in this expanding industry. While companies may look to build out multi-cloud environments, Microsoft's Azure offering will be a prime choice thanks to its decision to provide the same "stack" used in the public cloud, to companies for their on-premises data centers. Additionally, we would note that hybrid environments are currently the preference for most companies because they allow them to maintain critical data in-house while taking advantage of the agility and scalability provided by public clouds. Outside of the cloud opportunity, we maintain a positive view on the company's growing gaming business, which we believe is becoming an increasingly prominent factor in the Microsoft growth story as gaming becomes more mainstream, management works to convert its gaming revenue from one-time license purchase to a recurring subscription model and as technologies like augmented/virtual reality evolve. Finally, as it relates to LinkedIn and other subscription-based services such as O365 and various Dynamics products, we continue to value them highly for their recurring revenue streams, which, we remind members, provide for greater transparency of future earnings.
Target Price: $480; Rating: Two
Panic Point: Reiterate $375
RISKS: Slowdown in IT spending, competition, cannibalization of on-premises business by the cloud.
Morgan Stanley MS; $133.11; 1,462 shares; 3.94%; Sector: Financial Services
UPDATE: Shares of Morgan Stanley (MS) were a vibrant performer for the portfolio during Q4 2024 and that strength continued in January. During February, the shares gave back some of those gains, but year-to-date they remain a positive force in the portfolio. Coming into February, Morgan’s healthy M&A pipeline and prospects for other investment banking business remained healthy. We continue to see the Trump administration and reduced regulation supporting the M&A market, but we recognize recent stock market volatility could be a near-term headwind for the IPO market. The recently upsized SailPoint (SAIL) IPO that priced at $23 and is currently trading above that level is a positive development. Next week, Moove Lubricants is expected to price a 25 million share initial public offering between $14.50-$14.50. We will continue to follow upcoming IPO offerings and their pricing, especially those for higher profile expected offerings from Chime, Klarna, CoreWeave, and others. As the IPO market firms and positive momentum builds, we could see a stronger IPO market emerge and that would be a catalyst for us to revisit our MS price target. Barring a near-term pick up in M&A and IPO market activity, we see support for MS shares near $127 but a more attractive level to scoop up shares in near $115.
1-Wk. Price Change: 1.1%; Yield: 2.8%
INVESTMENT THESIS: Morgan Stanley reports in three business segments: Institutional Securities (42% of trailing 12-month revenue, 38% of trailing 12-month Income Before Tax), Wealth Management (48%, 55%) and Investment Management (10%, 6%). While the IPO window has yet to reopen, the potential IPO class for 2024 continues to build with recent additions including Panera Bread, Reddit, Fanatics, and Skims, which is backed by Kim Kardashian. This along with the Fed increasingly likely to start cutting rates in H2 2024, suggests we are far closer to the IPO window opening on a sustained basis than we have been in some time. That would be a boon to private equity firms and others that have been nursing IPO candidates during the dark period and a positive for Morgan's investment banking business. Marginally lower rates could also generate a pick-up in M&A activity as the cost of capital with rates improving. As the Fed continues its cutting cycle to get rates back to normalized levels, that effort would also reduce rates for stock market alternatives, ones that quashed the "there is no alternative" trade earlier this year. That along with folks continuing to be behind in retirement savings bodes well for Morgan's wealth management business in the coming quarters. We see several gaps in the chart over the last few months, and all things being equal if the shares retreated near $120, we would be inclined to revisit our Two rating.
Target Price: $145; Rating Two
Panic Point: $110
RISKS: Market and interest rate risk, credit risk, country risk, and operational risk, including cybersecurity.
VanEck Uranium and Nuclear ETF NLR; $79.31; 478 shares; 0.77%; Sector: Industrials
UPDATE: We started a small position in the VanEck Uranium and Nuclear ETF (NRL) in late January to capture the growing interest in using nuclear power to help solve the data center and larger power demand problem. Today nuclear power provides ~10% of the world’s electricity and about 20% of Europe’s electricity. Per Goldman Sachs, power demand from data centers is on track to grow more than 160% by 2030, compared to 2023 levels. In the U.S. alone, big tech companies have signed new contracts for more than 10 GW of possible new nuclear capacity in the last year. From Texas to France and Germany to Japan, fresh plans for nuclear capacity are being put forth. Over the last month, NLR shares have moved lower in sympathy with others serving the data center market, and that has them close to being oversold. As such, we are contemplating levels to scoop up more shares for the portfolio, a move that could happen should the market move closer to being oversold.
1-Wk. Price Change: -5.2%; Yield: 0.0%
INVESTMENT THESIS: The VanEck Uranium and Nuclear ETF seeks to replicate as closely as possible, before fees and expenses, the price and yield performance of the MVIS Global Uranium & Nuclear Energy Index (MVNLRTR), which is intended to track the overall performance of companies involved in: (i) uranium mining or uranium mining projects; (ii) the construction, engineering, and maintenance of nuclear power facilities and nuclear reactors; (iii) the production of electricity from nuclear sources; or (iv) providing equipment, technology and/or services to the nuclear power industry. We see the companies captured in NLR helping address the energy paint point that will be created in part by the expected data center build-out. Figures from the International Energy Agency see a potential doubling of global data center electricity consumption by 2026, driven primarily by the rise of artificial intelligence (AI) applications, potentially reaching over 1,000 terawatt hours (TWh) from the current 460 TWh in 2022. In response, we are seeing companies ranging from Blackstone to Microsoft and Meta announce plans to invest in nuclear power to help power its growing AI operations.
Target Price: $98; Rating: Two
Panic Point: $73
RISKS: Nuclear energy and energy market risks, currency and foreign exchange, political and economic.
Waste Management WM; $232.78; 720 shares; 3.40%; Sector: Industrials
UPDATE: In late December we picked up more shares of Waste Management (WM) for the portfolio at $205.67, and in mid-February as the shares approached overbought levels we trimmed back the portfolio’s exposure at $227.49. After reviewing the results and digesting the company’s earnings call, we boosted our WM price target to $245 from $230 to reflect expected continued top-line growth and margin expansion over the coming quarters. Those efforts should be fueled by continued adoption of technology and automation across WM’s core residential business, management’s focus on disciplined pricing, and initial synergies of $100 million this year as it integrates Stericycle. Those acquisition synergies are expected to be more heavily weighted to the second half of 2025 and 2026, and a more meaningful update could come at WM’s June Investor Day. At the June Investor Day, we expect a more concrete roadmap for those cost synergies as well as revenue ones. As we get those details, we’ll revisit our $245 target as needed. While the shares are once again overbought, should they pull back near $215, which has nice support given the tightness of the 100-day and 50-day moving averages, that could give us enough upside to reconsider an upgrade. And that’s before we factor in the company’s 2025 annual dividend of $3.30 per share, up from $3.00 last year.
1-Wk. Price Change: 2.1%; Yield: 1.4%
INVESTMENT THESIS: 2025 will see more nonresidential construction activity because of the Biden Infrastructure Law, but now we can finally factor in activity for the CHIPs Act, which saw its first award this week. Other potential drivers include spending associated with the Inflation Reduction Act, including the much-awaited start of building out a nationwide network of EV charging stations. Alongside that bright outlook for WM's commercial business, automation efforts and pricing power in its sticky residential business should drive margins and EPS generation higher in the coming quarters.
Target Price: $245; Rating: Two
Panic Point: $185
RISKS: Industry and economic risk, competition and competitive pressures, and acquisition risk.
THREES
Lockheed Martin Corp. LMT; $450.37; 388 shares; 3.54%; Sector: Aerospace & Defense
UPDATE: Lockheed Martin (LMT) shares continued to move lower in the first half of February, adding to their January drag on the portfolio. Headline concerns over the potential impact of the Department of Government Efficiency (DOGE) and reports of defense budget spending were the culprit. Mid-month we downgraded LMT shares to a Three rating following Defense Secretary Pete Hegseth’s confirmation hearings where he shared that he wouldn’t want to spend less than 3% of GDP on defense compared to the 3.4% of GDP it has been running at. That suggests a potential cut between 12%-15% on defense spending, which would be mitigated by ramping defense spending outside the U.S. Subsequently LMT shares have rebounded amid reports defense spending cuts are more likely to resemble 8% or $50 billion from an expected $850 billion budget. While better than feared, we are still waiting on confirmation of specific programs to be cut and the possibility of an annual 8% cut over the next five years. As these details become clear, we’ll revisit the rationale for the portfolio continuing to own LMT shares. We will also continue to track program wins for Lockheed and what they mean for its multi-year record backlog. Also on the horizon is the March 14 government funding deadline.
1-Wk. Price Change: 2.2%; Yield: 2.9%
INVESTMENT THESIS: Lockheed Martin is the largest defense contractor globally and has dominated the Western market for high-end fighter aircraft since the F-35 program was awarded in 2001. Lockheed's largest segment is aeronautics, which is dominated by the massive F-35 program. Lockheed's remaining segments are rotary and mission systems, which is mainly the Sikorsky helicopter business; missiles and fire control, which creates missiles and missile defense systems; and space systems, which produces satellites and receives equity income from the United Launch Alliance joint venture. Historically, the stability of defense spending has been a haven during periods of economic uncertainty, and we see that repeating once again even as geopolitical conflicts are likely to lead to incremental demand for Lockheed's products. The company has increased its dividend consistently over the last 19 years and is widely expected to boost it again in the coming days. In October 2022, Lockheed announced its board authorized the purchase of up to an additional $14.0 billion of LMT stock under its share-repurchase program.
Target Price: $575; Rating: Three
Panic Point: $445
RISKS: Contracts and budget risk with the U.S. government and the Department of Defense, F-35 program funding and renewal, competition, and subcontractor issues.
Not Rated
ProShares Short QQQ ETF PSQ; $37.88; 1,430 shares; 1.10%
WEEKLY UPDATE: We called shares of the ProShares Short QQQ ETF (PSQ) back into the portfolio in early February to offset expected market volatility and investor uncertainty associated with pending Trump tariffs and increasingly sticky inflation that would push out market rate cut timing expectations. Pushouts in the timing for Trump tariffs and Fed Chair Powell admitting the Fed had more work to do following the hotter-than-expected January CPI report led us to trim back the portfolio’s PSQ exposure. An early look at February PMI data and souring consumer inflation expectations put PSQ shares to work for the portfolio. We will continue to evaluate market dynamics and the rationale for continuing to own PSQ shares in the portfolio. Should the market become oversold or tariff and inflation concerns abate, those would be reasons for us to contemplate exiting PSQ shares.
1-Wk. Price Change: 3.5%; Yield: 0.0%
INVESTMENT THESIS: ProShares Short QQQ ETF seeks daily investment results, before fees and expenses, that correspond to the inverse (-1x) of the daily performance of the Nasdaq 100 Index. The Nasdaq 100 Index includes 100 of the largest domestic and international non-financial companies listed on The Nasdaq Stock Market based on market capitalization.
Target Price: N/A
Panic Point: N/A
RISKS: Because PSQ shares track the inverse of the Nasdaq 100 Index, PSQ shares will move lower when the Nasdaq 100 Index moves higher.
ProShares Short S&P500 ETF SH; $42.24; 1,250 shares; 1.07%
WEEKLY UPDATE: We called shares of the ProShares Short S&P 500 ETF (SH) back into the portfolio in early February to offset expected market volatility and investor uncertainty associated with pending Trump tariffs and increasingly sticky inflation that would push out market rate cut timing expectations. Pushouts in the timing for Trump tariffs and Fed Chair Powell admitting the Fed had more work to do following the hotter-than-expected January CPI report led us to trim back the portfolio’s SH exposure. An early look at February PMI data and souring consumer inflation expectations put PSQ shares to work for the portfolio. We will continue to evaluate market dynamics and the rationale for continuing to own SH shares in the portfolio. Should the market become oversold or tariff and inflation concerns abate, those would be reasons for us to contemplate exiting SH shares.
1-Wk. Price Change: 1.1%; Yield: 0.0%
INVESTMENT THESIS: ProShares Short S&P 500 ETF seeks daily investment results, before fees and expenses, that correspond to the inverse (-1x) of the daily performance of the S&P 500. We are using SH shares to blunt market volatility and hedge the portfolio's performance against its benchmark, the S&P 500. Given the tactical nature of this position, we do not expect to hold SH shares for the same length of time as we do the portfolio's long positions.
Target Price: N/A
Panic Point: N/A
RISKS: Because SH shares track the inverse of the S&P 500, SH shares will move lower when the S&P 500 moves higher.
