Betting Against the S&P 500 as New Reports Pressure Trump Trade Capitulation
The data points to stagflation, keeping the Fed in a box and pressuring Trump on trade.
You've reached your free article limit
You've read 0 of 1 free Pro articles.
Over the last few days, the stock market has continued to rally, putting it on a path to meet a potential resistance line at the S&P 500’s 50-day moving average at just over 5,613, less than 1% from Tuesday night’s closing price.
In the chart below, you can also see additional layers of resistance for the S&P 500.
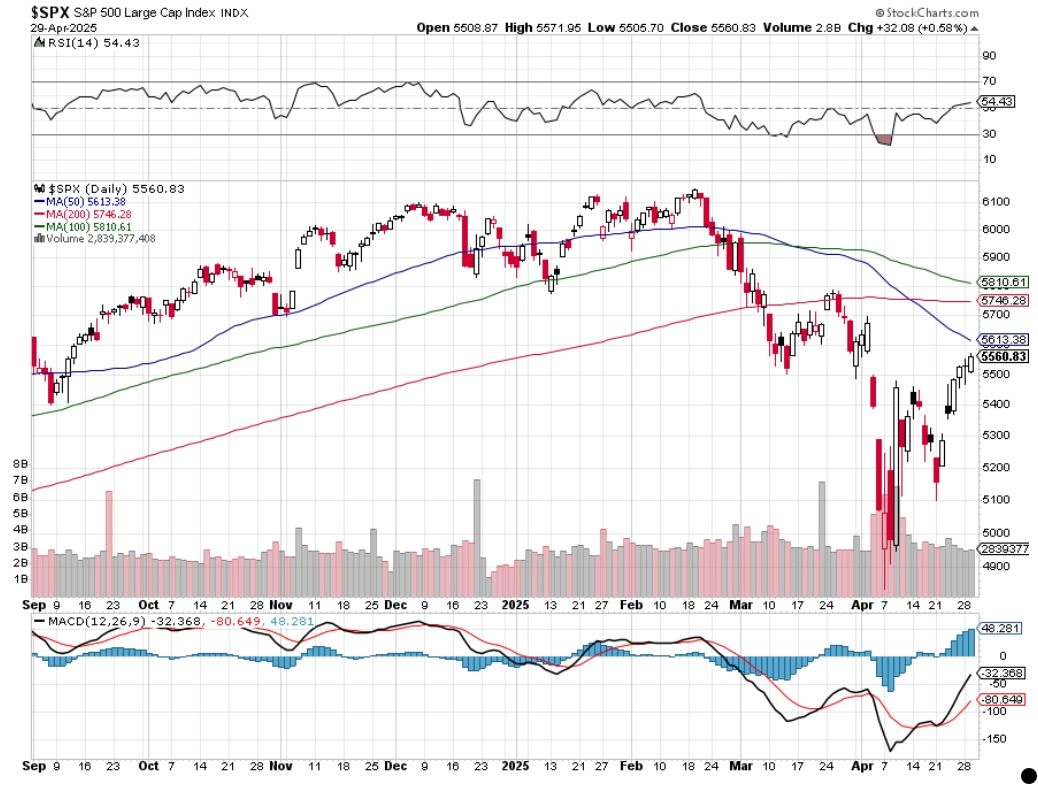
As we think about that, let’s not forget the 15% move that the market index has put in since rebounding sharply from its April 7 low of nearly 4,835. Quite a move indeed, and it’s been fueled not by the bulk of companies reporting beat-and-raise quarters, but by the softening of some Trump tariffs and the hope trade deals will emerge sooner than later. We heard from Treasury Secretary Scott Bessent on Tuesday that about 17 of the U.S.’s 18 key trading partners, but as we discussed, those are likely to be inked in the coming weeks, not days.
The one missing? China, and it seems that one will take time for a potential deal to be hammered out.
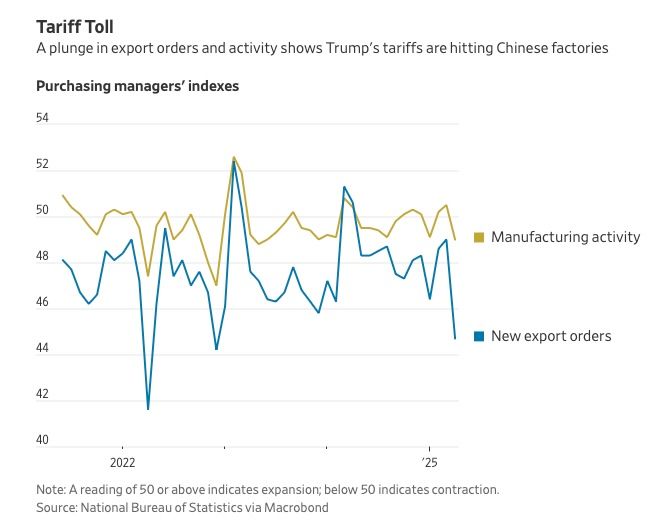
Earlier this week, we shared data about falling port and airfreight handler volumes. That was confirmed on Wednesday morning by April China Manufacturing PMI declines that included new order levels that are continuing to soften and new export orders falling at a fast pace due to U.S. tariff hikes. Those figures were captured by the monthly Caixin index, but the ones from China’s official NBS data show an even steeper drop in new export orders.
Thursday brings the first wave of April PMI data for the U.S., namely the Manufacturing figures for the month followed by the ones for the Service sector early next week. While the Flash data from S&P Global showed an uptick in April manufacturing, Thursday's final PMI data will have more complete data, and we will be looking to see if the pick up in the Flash Manufacturing PMI data was just the pulling forward of activity ahead of tariffs or something else.
Following the initial 0.3% contraction reported this morning in 1Q 2025 GDP, a sharp slowdown compared to the 2.4% figure for 4Q 2024, all eyes will be on the final April Manufacturing and Service PMI figures to determine the speed of the economy and the impact of tariffs. As it was, the initial 1Q 2025 GDP report showed the GDP Price Index climb to 3.7% from 2.3% in 4Q 2024, a much hotter figure than the market consensus of 3.1%. Even the core PCE Price Index reading for 1Q 2025 came in hotter than expected at 3.5% versus 2.6% in 4Q 2024, and that was before the impact of tariffs.
While some may point to the Fed needing to cut rates given that initial 1Q 2025 GDP print, the odds of Fed Chair Powell delivering on that are, at least for now, low, given what those inflation figures revealed.
Let’s remember that we will want to also pay close attention to the Fed’s other mandate: maximum employment. That will be a key topic with Friday’s April Employment Report following Wednesday morning’s sharp miss in the April ADP Employment Report. ADP found 62,000 jobs were created during the month, down sharply from 147,000 in March and the 1Q 2025 monthly average of 139,000. That 62,000 figure was also well below the market forecast of 115,000 jobs.
As we think about that and Friday’s Employment Report, which currently is expected to show 130,000 jobs being added in April, down from 228,000 in March, our mind goes to the spike in announced layoffs found in the February and March Challenger Job Cuts Report. Those sharp increases reflected job cuts in the public sector tied to DOGE activity, and we’ll get another look at that with Thursday's Challenger Job Cuts Report for April. Thursday also brings the employment data contained in the April Manufacturing PMI reports.
Amalgamating that data will help us sharpen expectations for the April Employment Report but based on what we’ve seen so far across the data outlined above, it looks like something that will put the Fed in a box, namely stagflation. Likely, this means President Trump will dial up his criticism of the Fed and point the finger at Fed Chair Powell, who is likely to remain data dependent. That leaves the door open for some market disappointment relative to the number of rate cuts it sees in the coming months.
Given our comments above about the April rebound in the S&P 500 and technical resistance levels ahead, we’ll continue to own the inverse ETF positions in the Portfolio and hang onto its cash as we navigate what’s ahead.
Gaming it out, the data discussed above and what we see in the upcoming reports are likely to put that much more pressure on Trump to announce trade deals or soften tariffs further. Should we see Trump announce some trade deals, the market will likely react positively, but for our money, the details of any such agreements relative to Trump’s reciprocal tariffs will be what matters.
