August Portfolio Roundup: A Busy and Net-Positive Month for the Portfolio
We've got ample firepower and our shopping list ready should September live up to its reputation as a challenging time for the market.
You've reached your free article limit
You've read 0 of 1 free Pro articles.
Author Victoria Erickson once described August as “the slow, gentle month that stretches out the longest across the span of a year.” While that may be the case some years, this August was a busy one for the Pro Portfolio. It was also one in which the market performed better than the average August, with the S&P 500 adding 1.9%. Even though that market barometer posted a modest decline during the last week of the month, it tagged new record highs during the week. That, mixed with moves we made in July and August, led the Portfolio to further advance its year-to-date performance during the month.
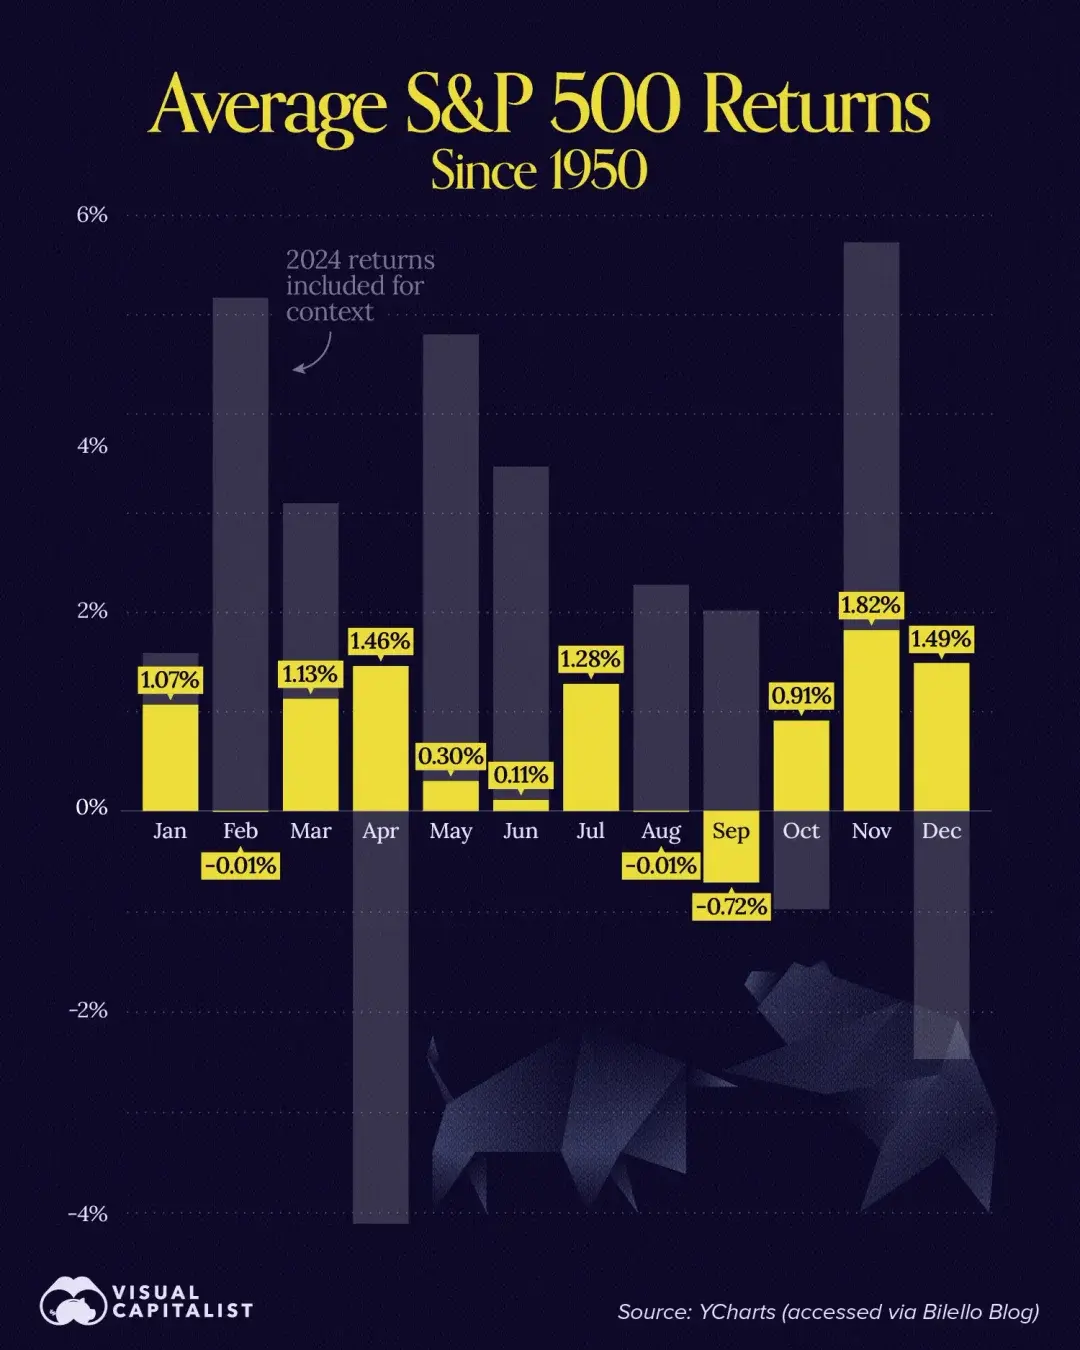
This is all well and good, but as you can see in the chart above, we are entering what historically has been the most challenging month for the S&P 500. There are multiple reasons for that, ranging from clients informing hedge funds about year-end redemptions that may require up to 90 days of notice, to companies sharing updated expectations for the balance of the year as they make the September investor conference rounds.
Those two factors remain in play this year, but we also have the highly anticipated September Fed meeting, which the market overwhelmingly expects will deliver not just a rate cut but the start of a rate-cutting cycle. That’s right, the CME FedWatch Tool shows the market thinking the Fed will deliver three 25-basis point rate cuts during the final four months of the year.
We’ve discussed recent inflation data and why the August economic data coming over the next two weeks will tell us if a September cut is likely or if the market is again filled with hopium.
During August, there have been multiple price target increases for the S&P 500. UBS lifted its target to 6600 from 6100, joining Citibank and Goldman Sachs. Morgan Stanley and Deutsche Bank are between 6500 and 6550, while Oppenheimer Asset Management is the big bull with a 7100 target. To move meaningfully past that growing market consensus near 6600, which offers just over 2% potential upside from the S&P 500’s August close, we would need to see S&P 500 EPS expectations move higher. We say this because the current P/E multiple for the S&P 500 is just over 24x, a hair away from the 24.3x P/E multiple associated with the index’s recent record high.
Over the last several trading sessions, we’ve learned that a growing number of retailers are planning price hikes. meanwhile, heavy equipment company Caterpillar (CAT) shared that it now sees the net impact of tariffs to be around $500 million-$600 million in the current quarter, up from its prior view of $400 million-$500 million. For 2025, the company now estimates the impact will be $1.5 billion-$1.8 billion compared to its prior assessment of $1.3 billion-$1.5 billion. Odds are, Caterpillar won’t be the only company revising those figures.
Given those and other pieces moving around the earnings expectation chessboard, company investor conference comments over the next two weeks have the potential to take EPS expectations for the second half of 2025 higher… or lower. With two-thirds of the current quarter in the bag and where things stand on tariffs, we expect management teams will be peppered with questions during conference Q&A sessions.
We will be listening closely to what is said — and what’s not said. Former head of Citigroup Sandy Weill said details create the big picture, and we could not agree more. That is why we will focus on connecting the dots across these upcoming conferences, refreshing our thinking based on what we learn, and repositioning the Portfolio as needed.
Should we see the market come under pressure, like we have in the past, we’ve got our shopping list in hand (see below) and we’ll be looking at some other options as well. Given where the market is and what’s ahead, the smart move is to be ready to take advantage of situations that may not go as the market planned. In other words, short-term pain for longer-term gain.
As part of that, we will continue to lean into companies benefiting from pronounced tailwinds that are poised to deliver superior EPS growth prospects. We will begin September with an updated chart of consensus EPS expectations for the Portfolio’s holdings, and a look at expected EPS growth rates in H2 2025 compared to H1 2025.
As we prepare that analysis, we will share that as we put August to bed, the S&P 500 is now expected to grow its EPS just 5.6% in H2 2025 compared to H1 2025. That’s down from 7.9% at the end of July, 8.5% exiting June, and a far cry from 13.9% closing out Q1 2025.
Enjoy the holiday weekend. We’ll be ready to rumble when we see you back here on Tuesday.
Catching Up on the Portfolio in August
While the Portfolio contended with the sharp drop in Marvell (MRVL) shares during the last week of August, that impact was offset by the significant move in Dutch Bros (BROS) and meaningful gains in American Express (AXP) , ServiceNow (NOW) , Alphabet (GOOGL) , and Bank of America (BAC) . The net effect of those moves and others led the Portfolio to gain modest ground this week while the S&P 500 moved lower.
During August, we didn’t initiate any new positions, but we made several trades over the course of the month that led us to book gains, when we took some Axon (AXON) chips off the table, as well as some losses, when we closed the Portfolio’s position in Elastic (ESTC) earlier than we should have.
Over the balance of the month, we put that returned capital to work by opportunistically adding to existing positions in American Express, ServiceNow, SuRo Capital (SSSS) , Waste Management (WM) , Palantir (PLTR) , and Axon.
Those trades, combined with others we made in July, led the Pro Portfolio to finish August higher on a year-to-date basis compared to where it finished July. With their double-digit gains, standouts for the month included Dutch Bros, Apple (AAPL) , and American Express.
Entering September, just over 10% of the Portfolio’s assets are in cash, which means we have ample firepower should September live up to its reputation as a challenging time for the market. Our updated shopping list includes shares of Marvell, Palantir, TJX Companies (TJX) , and Microsoft (MSFT) . As we look to position the Portfolio for the seasonally strong market period of October-December, we’ll look for fresh opportunities and revisit one or two Bullpen candidates.
With respect to risk management, we will be mindful of companies that have made significant runs of late, have outsized position sizes, and whose relative strength index levels are deep in overbought levels. Mind you, we are all for letting our winners run, but when we see those three conditions emerge, portfolio discipline and prudent action tend to be the smarter course.
This Week's Portfolio Videos
We cover a lot of ground during the week in our Daily Rundowns. If you happened to miss one or more of them, here are some helpful links:
Monday, August 25: Mulling New Price Targets for 2 Financial Holdings
Tuesday, August 26: Change for U.S. Dollar Is an Overlooked Tailwind
Wednesday, August 27: Preparing for Nvidia’s Highly Anticipated Earnings
This Month’s Podcasts and Signals
Big discussions and insights are had during TheStreet Stocks & Markets Podcast, and in Signals, we share the latest news for the Pro Portfolio’s strategies. Here are some quick links to those conversations conducted over the last several weeks:
August 6: Stocks & Markets Podcast: Sectors to Avoid With Jay Woods
August 9: AI Is Taking Jobs Away, Shoppers Fret Over Prices, Columbia Hacked, More Investing News
August 13: Stocks & Markets Podcast: Crypto with David Namdar of CEA Industries
August 16: AOL Hangs Up on Dial-Up, Shoppers Get Picky, Tech Helps the Old, and More Investing News
August 20: Stocks & Markets Podcast: Thematic Investing 101
August 23: Young People Treats, Cautious Consumers, AI Stock Boost & More Investing News
Key Global Economic Readings
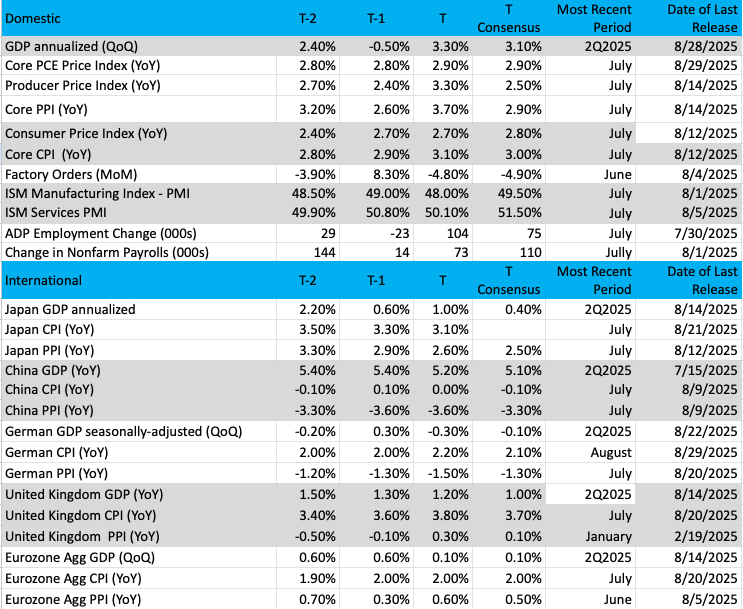
(Note: T is the most recent period, T-1 is the prior period's reading, and T-2 is two periods back, the intent being to illustrate any trends.)
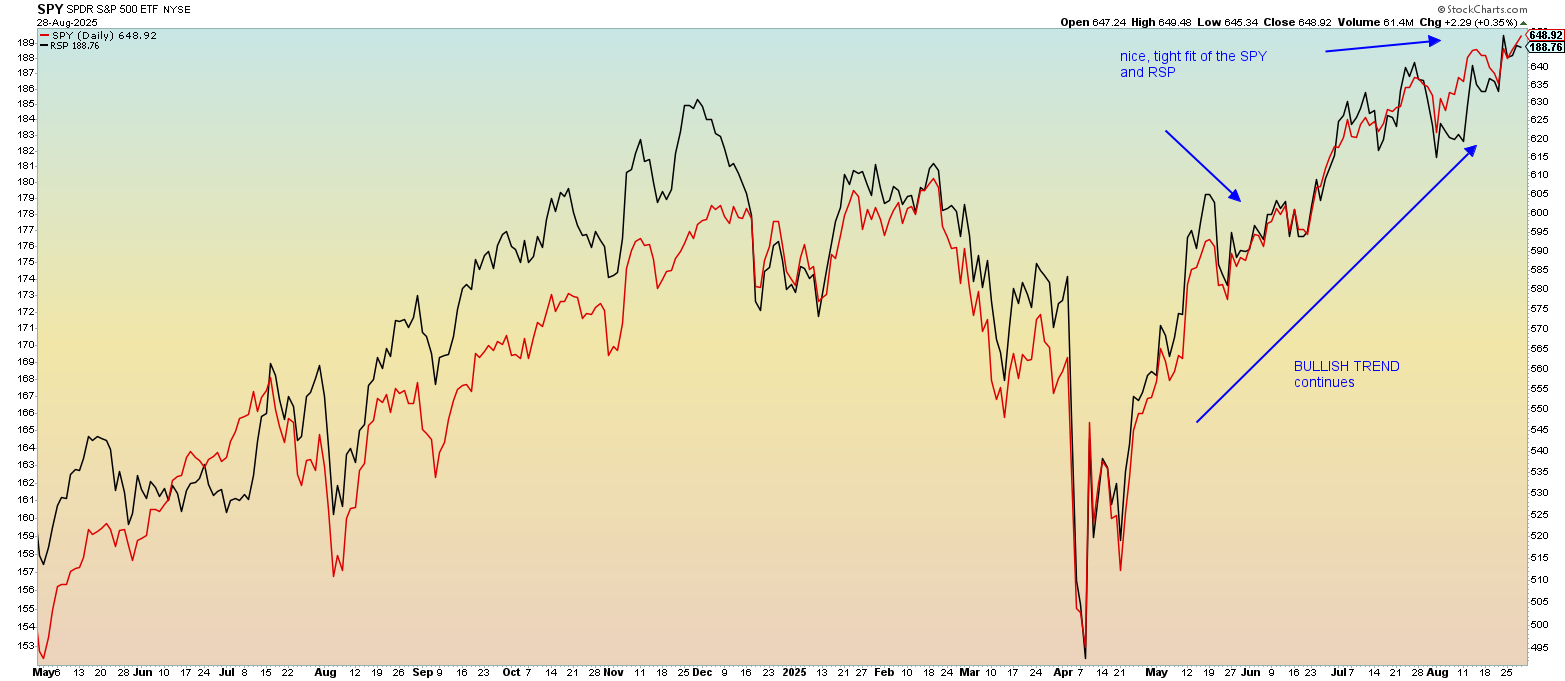
Chart of the Week: S&P 500 – Market Cap vs. Equal Weighted
In last week’s Roundup, we discussed the differences between the Nasdaq 100 ETF (QQQ) and the equal-weighted version, or the (QQQE) . Some subtle differences helped to explain the recent action, so perhaps we can see a few similar things in our monthly look at the S&P 500 ETF (SPY) and Invesco S&P 500 Equal Weight ETF (RSP) .
No question, the biggest name of them all, Nvidia (NVDA) , is going to have some influence here. The big semiconductor company is a whopping 8% of the S&P 500, a mammoth amount for just one company. In fact, it is the single largest component in the index since data began in 1981. It is not a subtle influence at all; further, many large investing institutions hold very large amounts of Nvidia shares.
But how does this weigh on the SPY and the differential between it and the RSP? Recall, the RSP, or the equal weight, gives one "vote" for each component. On a percentage basis, each company has a weighting of 0.2%. When the RSP is performing better than the SPY, we can reliably say there is broad participation among most components.
As we examine the two charts here, we notice that both the SPY and RSP are tracking each other well. This is not too common, as the chart shows there is often "separation" of the SPY and RSP unless stocks are falling. There are notable times, however (like in May/June this year), when the two ETFs track well as the markets are rising.
That condition is good news for the bulls if it continues. The tight fit between the two ETFs is an important way of showing that good broad participation continues to work in markets and that leadership from a select few (like the Magnificent Seven) is not the only driver of market results.
Other charts we shared with you this week were:
Monday, August 25: S&P 500 - Industrials Pushing for Impressive Milestone
Monday, August 25: Nvidia (NVDA) - Nvidia Eyes $200 Stock Price as Earnings Loom
Tuesday, August 26: Marvell (MRVL) - A Look at the Other Key Chip Stock Posting Earnings This Week
Wednesday, August 27: Amazon (AMZN) - What's Next for Amazon After the Stock's 'Stunning' Move?
Thursday, August 28: Waste Management (WM) - A Holding Pulls Back to a Reliable Buy Zone
The Week Ahead
While next week is an abbreviated one for the markets, it will be an important one given high expectations for not only a September rate cut but follow-on ones exiting the Fed’s October and December meetings. We have a full slate of August economic data to contend with, and as we discussed on Thursday and Friday following the upward-moving July PCE Price Index data, what the collected data have to say about the pace of job creation and inflation will have the market sitting on edge.
If the data found in the ISM Manufacturing and Service PMI reports for August, ADP’s August Employment Report, the latest Fed Beige Book, and the Bureau of Labor Statistic’s August Employment Report mimic what we saw in the August Flash PMI data from S&P Global, the market may need to reconsider Fed Chair Powell’s comment at Jackson Hole that depending on what happens and what is seen in the data, the Fed’s policy stance “may warrant adjusting.”
While the Volatility Index (VIX) moved higher on Friday, its current level and the Fear & Greed Index flashing “Greed” tell us there is room for the market to be rattled by what next week’s data could spell. Rest assured, we’ll break down it all piece by piece, starting with Tuesday’s August Manufacturing PMI reports, sharing what it all means for the market and the Fed. We’ll also continue to monitor developments regarding the Fed’s roster and be mindful of potential implications on the policy front.
As we assemble next week’s puzzle pieces and the additional ones we’ll get the following week, we’ll make prudent moves where necessary as we continue to manage the Portfolio for the longer term.
Here's a closer look at the economic data coming at us next week:
U.S.
Tuesday, September 2
· S&P Global Final US Manufacturing PMI – August (9:45 AM ET)
· ISM Manufacturing PMI – August (10:00 AM ET)
· Construction Spending – July (10:00 AM ET)
Wednesday, September 3
· MBA Mortgage Applications Index – Weekly (7:00 AM ET)
· Factory Orders - July (10:00 AM ET)
· JOLTS Job Openings & Quits – July (10:00 AM ET)
· EIA Crude Oil Inventories – Weekly (10:30 AM ET)
· Fed Beige Book (2 PM ET)
Thursday, September 4
· Challenger Job Cuts – August (7:15 AM ET)
· ADP Employment Change Report – August (8:15 AM ET)
· Initial & Continuing Jobless Claims – Weekly (8:30 AM ET)
· Trade Balance – July (8:30 AM ET)
· Unit Labor Costs – Q2 2025 (8:30 AM ET)
· S&P Global Final US Services PMI – August (9:45 AM ET)
· ISM Services PMI – August (10:00 AM ET)
· EIA Natural Gas Inventories – Weekly (10:30 AM ET)
Friday, September 5
· Employment Report – August (8:30 AM ET)
International
Monday, September 1
· China: NBS Manufacturing & Non-Manufacturing PMI – August
· China: Caixin Manufacturing PMI – August
· Japan: S&P Global Final Manufacturing PMI – August
· Eurozone: HCOB Final Manufacturing PMI – August
· UK: Bank of England Consumer Credit – July
· UK: S&P Global Final Manufacturing PMI - August
Tuesday, September 2
· Eurozone: Flash Inflation Rate - August
Wednesday, September 3
· Japan: S&P Global Final Services PMI – August
· China: Caixin Final Services PMI – August
· Eurozone: Final Services PMI – August
· UK: Final Services PMI – August
· Eurozone: Producer Price Index - July
Thursday, September 4
· UK: New Car Sales – August
· Eurozone: Retail Sales – July
Friday, September 5
· Japan: Leading Economic Index – July
· UK: Retail Sales – July
· Eurozone: Employment Change – Q2 2025
Following Nvidia’s quarterly results this week, more than 98% of the S&P 500 have reported, and that means we’ll be taking a closer look at revised S&P 500 EPS expectations when we’re back from the holiday weekend. While we have no Portfolio companies reporting next week, we have multiple ones presenting at various investor conferences. That includes Marvell on Wednesday, September 3, at the Citi 2025 Global TMT Conference, and we’ll be looking to see if the team shares more color on H2 2025 data center expectations as we plot our next move with the shares.
Other conferences next week include the Jefferies Industrials Conference, the Wells Fargo Healthcare Conference, TD Securities Growth Cap Summit, Truist Securities Technology Conference, and the Bank of America Media, Communications & Entertainment Conference.
As we juggle those presentations and connect the dots back to the Portfolio’s holdings, we’ll do the same with the rash of companies that are reporting next week. Those include Zscaler, Hewlett Packard Enterprise, Salesforce, Ciena, and Broadcom, and what they will say about end-market demand for cybersecurity, software and cloud, AI infrastructure, and smartphones.
Here's a closer look at the earnings reports coming at us next week:
Tuesday, September 2
· Open: Signet Jewelers (SIG)
· Close: Zscaler (ZS)
Wednesday, September 3
· Open: Campbell Soup (CPB), Dollar Tree (DLTR), Macy’s (M)
· Close: American Eagle (AEO), C3.AI (AI), Credo Technology (CRDO), Hewlett Packard Enterprise (HPE), Salesforce (CRM)
Thursday, September 4
· Open: Ciena (CIEN), Science Applications (SAIC), Shoe Carnival (SCVL)
· Close: Broadcom (AVGO), DocuSign (DOCU), lululemon Athletica (LULU), ServiceTitan (TTAN)
Portfolio Investor Resource Guide
· Economic Data: Here's a List of Links to the Key Economic Data We Closely Watch
· Investing Terminology: 16 Key Terms Club Members Should Know
· 10-Ks: Want to Know About a Stock? Read the Company's Reports
· 10-Qs: Unlock the Numbers and Key Information Behind Your Stock With the 10-Q
· Income Statement: Our Cheat Sheet to Understanding This Financial Document
· Balance Sheet, Cash Flow Statements, and Dividends: How to Know If a Company Is Off-Kilter? Read Its Balance Sheet
· Valuation Metrics: Everyone Wants a Value. Here's How Investors Can Find
· Thematic Investing 101 Webinar
The Portfolio Ratings System
1 - Buy Now (BN): Stocks that look compelling to buy right now.
2 - Stockpile (SP): Positions we would add to on pullbacks or a successful test of technical support levels.
3 - Holding Pattern (HP): Stocks we are holding as we wait for a fresh catalyst to make our next move.
4 - Sell (S): Positions we intend to exit.
ONES
Amazon AMZN; $229.00; 825 shares; 3.56%; Sector: Consumer Discretionary
UPDATE: After climbing significantly higher as the market rebounded off its early April low, shares of Amazon (AMZN) were a modest drag on the Portfolio during August. Entering the eight month of 2025, Amazon delivered June-quarter results that beat top-line and bottom-line consensus forecasts. As we saw it, two issues weighed on the shares as we began August. They were the company’s profit guidance for the current quarter, and the slower rate of cloud revenue growth in the June quarter compared to Alphabet and Microsoft. As we reviewed in our Alert analyzing the quarter and breaking down Amazon’s outlook, when the company has leaned in and invested in its businesses, the subsequent market reaction that has led to a selloff in AMZN shares has resulted in nice pick-up points for patient investors. AWS continues to be capacity-constrained, and there is a degree of lumpiness in the business from quarter to quarter. Much like we’ve seen with Microsoft, as Amazon adds cloud and data center capacity, we should see that business re-accelerate in the coming quarters and margins improve. Boosting our confidence in that was the continued increase in backlog levels for AWS to $195 billion exiting June, which was up 25% year over year. We’d also note that there was a re-acceleration in backlog growth compared to 20% in the March quarter. Given the influence of AWS on Amazon’s overall profitability, that improvement should drive overall margin improvement in the coming quarters. Longer-term, the ongoing shift in enterprise spending in IT toward cloud from on-premise spending, which currently accounts for the bulk of IT spending, bodes well for AWS, especially as AI adoption accelerates. It’s also fair to say that Amazon’s margin potential is greater this time around as its near-term investments bear fruit. We can make that argument given ongoing cost reduction efforts, but also the growing influence of its high-margin advertising business, which generated $15.7 billion in revenue during Q2 2025, up just shy of 50% over the last two years. More recent data show Amazon winning streaming video share, a positive for its advertising revenue stream. And as we suspected, Amazon’s extended Prime Day 2025 was a driver in it winning additional consumer wallet share against brick & mortar retailers. With Amazon continuing to expand same-day delivery to more areas across the U.S. by year-end, we see further share gains ahead. We continue to see Amazon well-positioned as cost-conscious consumers feel the pinch of tariffs and other inflation pressures and look to stretch their holiday shopping dollars when and where they can. With that in mind, we are awaiting word on the company's October shopping event, Prime Big Deal Days, which are likely to jumpstart the holiday shopping season. With 14% upside to our $260 target, we continue to rate AMZN shares a One, but if they move past $235, barring a catalyst to lift our price target, we may need to revisit our One rating.
August Monthly Price Change: -2.2%; Yield: 0.0%
INVESTMENT THESIS: We believe the upside will result from Amazon's continued eCommerce dominance, AWS's continued leadership in the public cloud space, and the ongoing growth of the company's advertising revenue stream, which feeds off Amazon's eCommerce business. Additionally, we think profitability will continue to improve as AWS and advertising account for a larger portion of total sales, as both these segments sport higher margins than the eCommerce operation. While we believe the increasing share of the revenue from these higher margin businesses will be key to driving profitability longer-term, we think margins on eCommerce stand to improve as the company's infrastructure is further built out and economies of scale further kick in. The embedded call option is that management is always looking to enter a new space and generate new revenue streams.
Target Price: Reiterate $260; Rating: One
Panic Point: $190
RISKS: High valuation exposes the stock to volatile swings, e-commerce has exposure to slower consumer spending and competition, management is not afraid to invest heavily, potential headwinds resulting from new e-commerce regulation in India, and management is not scared to invest aggressively for growth, which can at times cause volatile reactions as near-term concerns arise relating to the impact on margins.
Costco Wholesale COST; $943.32; 218 shares; 3.82%; Sector: Consumer Staples
UPDATE: Despite the clear indication that Costco (COST) continues to win consumer wallet share seen by comparing its July sales against the July Retail Sales Report, Costco shares closed August up only slightly. That net result hides the sharp move higher and subsequent fade amid renewed concerns over consumer spending and tariffs. However, as we discussed in early August, signs point not only to bifurcated consumer spending patterns, but per Target, consumers are being choosy in their spending as they face inflationary pressure across their household spending. In our view, that explains why Costco continues to win consumer wallet share. As we move deeper into the second half of 2025, the company’s high-margin membership fee revenue stream should see a more pronounced impact from its September 2024 price hike. The next known catalyst for COST shares will be the company’s August sales results on September 4 and its quarterly results on September 25. In late July, we picked up more COST shares for the Portfolio near $939, and with the shares back near those levels, we continue to rate them a One.
August Monthly Price Change: 0.4%; Yield: 0.5%
INVESTMENT THESIS: We like Costco's long-term prospects, driven by a club-based operating model that focuses on volumes, not margins, and therefore offers its customers a value proposition of everyday low prices. The strength of this model has created an incredibly loyal customer base with low churn and continued share gains in both brick-and-mortar and e-commerce. This is a global concept, evidenced by the strength of sales both in the U.S. and abroad, which includes an emerging China opportunity. We see the company's membership model as a key differentiator vs. other retailers, and its plans to open additional warehouse locations in the coming quarters should drive retail volumes and the higher-margin membership fee income as well. We also appreciate management's approach to capital returns and their willingness to return cash.
Target Price: Reiterate $1,200; Rating: One
Panic Point: $925
RISKS: Inability to pass through higher costs, fuel prices, weaker consumer, and membership churn.
Eaton Corp. ETN; $349.14; 593 shares; 3.85%; Sector: Industrials
UPDATE: Coming off a more than 40% rise in Eaton (ETN) during the April-July period, the shares gave back some of those gains and then some in August. While that may frustrate some, given our price target and the vibrant demand outlook, we see the move lower allowing us to reiterate our One rating. As we see it, the outlook for data center infrastructure and the larger demand for electrical capacity remains shockingly strong. Companies will spend $375 billion globally in 2025 on A.I. infrastructure, investment bank UBS estimates. That is projected to rise to $500 billion next year. Brookfield Asset Management estimates that A.I. infrastructure will sop up $7 trillion over the next 10 years. Deloitte sees U.S. power sector investments reaching $1.4 trillion between 2025 and 2030. This six-year outlay is equivalent to the total capital expenditure of the U.S. power sector over the preceding 12 years, underscoring the challenge and the opportunity that lies ahead. A recent report from ICF projects significant increases in U.S. electricity demand over the next 25 years, with demand rising 25% by 2030 and 78% by 2050. In the near term, the U.S. Energy Information Administration (EIA) has raised its projections for electricity consumption in the country, citing a spike in power demand from commercial sectors — especially data centers — as a key driver. In its latest update of the Short-Term Energy Outlook (STEO), the EIA said it expects total U.S. electricity demand to rise from 4,097 billion kilowatt-hours (kWh) last year to 4,193bn kWh in 2025, and 4,283bn kWh in 2026. As we see the mix shift move toward AI data centers, we should see Eaton’s dollar per megawatt content rise, given greater power density, larger volumes of electrical equipment, but also greater cooling requirements. In our view, that is the driving story behind the opportunity in Eaton’s shares and one we aim to capture as shareholders. We recognize there will be some modest margin pressure, largely on the company’s Vehicle segment, due to tariffs, but we will continue to evaluate that as trade deals are announced. Following the company’s June-quarter results earlier this month and upsized capital spending levels at electric utilities, we lifted our ETN price target to $420 from $400. While the Portfolio’s position is large, with strong support between $328-$331, the risk-to-reward trade-off would be compelling enough for us to nibble further.
August Monthly Price Change: -9.2%; Yield: 1.2%
INVESTMENT THESIS: Eaton is an intelligent power management company that makes products for data center, utilities, industrial, commercial, machine building, residential, aerospace, and mobility markets. That business is positioned to capitalize on the megatrends of electrification, energy transition, and digitalization. We see Eaton helping address the power pain point created by data center, EV charging infrastructure, and other drivers of electricity demand. Research estimates that data center power demand will grow 160% by 2030, accounting for 3%-4% of global power, up from 1%-2% today. Data centers will use 8% of U.S. power by 2030, compared with 3% in 2022.
Target Price: Reiterate $420; Rating: One
Panic Point: $325
RISKS: Raw material costs, labor costs, end market volatility, and government legislation.
Marvell Technology MRVL; $62.87; 2,735 shares; 3.20%; Sector: Technology
UPDATE: Through the vast majority of August, Marvell (MRVL) shares were a modest drag on the Portfolio, like we saw with Nvidia. However, following the company’s in-line July quarter earnings report and similar guidance on August 28, the ensuing decline led MRVL shares to become the Portfolio’s biggest underperformer for the month. As we explained in our analysis of the July quarter, we were disappointed in Marvell’s guidance approach, but in our view, the August 29 pressure in the shares will eventually be viewed as an overreaction to an in-line quarter and in-line guidance. For us, the company’s story is tracking with what was laid out during its June custom AI silicon event, custom AI silicon programs ramping in the coming quarters, and the rebound in Carrier Infrastructure and Enterprise Networking is playing out as we suspected. Operational leverage is emerging that is delivering more to Marvell’s bottom line, and despite in-line guidance, year-over-year EPS growth will be significant in the current quarter. That should continue as multiple AI and data center programs ramp in the coming quarters, and explains why the market sees Marvell delivering EPS of $3.50 in 2025, up from $2.80 this year, and $1.57 in 2024. The fall in MRVL means the same for the Portfolio’s position size, and that will give us room to pick up some additional shares in the coming days. We will temper that action against the upcoming slate of August economic data and what it could mean for a market that expects multiple rate cuts in the last four months of 2025. We understand some folks are frustrated with the Portfolio’s position in Marvell, and we get that. But so long as the story is tracking and supported by data, we’ll look to take advantage of mispriced reactions in the market. Our thinking is that, as more than 90% of Marvell’s business is humming a few quarters from now, the July 2025 quarter guidance will be deep in the rear view. Should it become evident its design wins are not matriculating, or other signs emerge that it is losing market share, we will revisit our MRVL position in the Portfolio. Good or bad, we’ll follow the data and act accordingly. Next up, Marvell’s presentation at the Citi 2025 Global TMT Conference on September 3, and August revenue reports from TSM and Foxconn.
August Monthly Price Change: -21.8%; Yield: 0.4%
INVESTMENT THESIS: Marvell is a fabless supplier of high-performance standard and semi-custom infrastructure semiconductor solutions. These solutions power the data economy, enabling the data center, carrier infrastructure, enterprise networking, consumer, and automotive/industrial end markets. With roughly 75%-80% of Marvell's revenue stream tied to digital infrastructure, we see it continuing to benefit from rising content consumption and creation. Pointing to that rising demand that necessitates network densification and the build of digital infrastructure, Ericsson sees global monthly average usage per smartphone reach 46 gigabytes (GB) by the end of 2028 vs. 19 GB in 2023 and 15 GB in 2022.
Target Price: Reiterate $115; Rating: One
Panic Point: $60
RISKS: Technology risk, customer risk, competition risk, reliance on manufacturing partners, and supply chain constraints.
Nvidia Corp. NVDA; $174.18; 1,255 shares; 4.06%; Sector: Technology
UPDATE: Following a more than 12% move in July, fueled by rising data center capital spending plans from Big Tech companies, shares of Nvidia (NVDA) were a modest detractor to the Portfolio’s gains in August. During the month, we shared multiple data points and signals that pointed to rising AI adoption as well as rising AI infrastructure spending. When Nvidia reported its July-quarter results in late August, it delivered consensus-topping results and guided the current quarter above consensus forecasts. The degree to which that revenue guidance bested market expectations failed to live up to overly frothy expectations. While the market revenue forecast for the current quarter was $53.46 billion, the range of revenue expectations was $47 billion to $63 billion. The “miss” relative to the upper end of that range is allowing some to call for a slowdown in revenue, but the reality is that Nvidia’s top-line guidance still calls for more than 50% year-over-year growth. We also know capital spending on AI and data center infrastructure is moving higher in H2 2025 compared to H1 2025, with another leg up set for 2026. Nvidia’s revenue guidance for the current quarter also does not include any H20-related China product, even though the company signaled it could ship $2 billion-$5 billion in product this quarter if the geopolitical stars align. Ahead of upcoming August revenue reports from Taiwan Semi and Foxconn and Nvidia’s presentation at the Goldman Sachs Communicopia & Technology Conference, we opted to maintain our $200 NVDA price target. As we digest those items as well as other comments we collect from other investor conferences in the coming weeks, we’ll revisit our NVDA price target as needed. Because the Pro Portfolio has a sizable position in Nvidia, we are not likely to add to it. We’ll look for favorable risk-to-reward entry points for members who are underweight the shares, especially as we move into September, a month that tends to be a challenging one for the markets. If upcoming August economic data confirms a rebound in job growth and inflation ticking higher, the outcome of the Fed’s September policy meeting could continue that trend. That could bring an NVDA opportunity.
August Monthly Price Change: -2.1%; Yield: 0.02%
INVESTMENT THESIS: Nvidia is well-positioned to benefit from ramping AI and data center spending. The company pioneered accelerated computing to help solve the most challenging computational problems. Nvidia is now a full-stack computing infrastructure company with data-center-scale offerings that are reshaping the industry. The company's full stack includes the foundational CUDA programming model that runs on all Nvidia GPUs, as well as hundreds of domain-specific software libraries, software development kits, or SDKs, and Application Programming Interfaces, or APIs. This deep and broad software stack accelerates the performance and eases the deployment of Nvidia accelerated computing for computationally intensive workloads such as artificial intelligence, model training and inference, data analytics, scientific computing, and 3D graphics, with vertical-specific optimizations to address industries ranging from healthcare and telecom to automotive and manufacturing. Nvidia reports in two business segments: Compute & Networking and Graphics. The Compute & Networking segment (78% of revenue, 85% of operating income) is comprised of Data Center accelerated computing platforms and end-to-end networking platforms, including Quantum for InfiniBand and Spectrum for Ethernet; NVIDIA DRIVE automated-driving platform and automotive development agreements; Jetson robotics and other embedded platforms; Nvidia AI Enterprise and other software; and DGX Cloud software and services. The Graphics segment (22% of revenue, 15% of operating income) includes GeForce GPUs for gaming and PCs, the GeForce NOW game streaming service and related infrastructure; Quadro/NVIDIA RTX GPUs for enterprise workstation graphics; virtual GPU, or vGPU, software for cloud-based visual and virtual computing; automotive platforms for infotainment systems; and Omniverse Enterprise software for building and operating metaverse and 3D internet applications.
Target Price: $200; Rating One
Panic Point: $130
RISKS: Market and interest rate risk, credit risk, country risk, and operational risk, including cybersecurity.
Palantir Technologies PLTR; $156.71; 1,030 shares; 3.00%; Sector: Financial Services
UPDATE: After its meteoric rise earlier this year, Palantir (PLTR) popped from $160 to hit a 52-week high at $190 on August 12 following the company’s June-quarter earnings and subsequent price target hikes across Wall Street. We initially lifted our price target to $190 but boosted it further as we took a more detailed look at Palantir's remaining performance obligations (RPOs) exiting the June quarter. Total RPOs reached $2.4 billion exiting the June quarter, with $1.02 billion in short-term RPO and the remaining $1.4 billion in long-term RPO. Those deal wins and RPO led Palantir to guide the current quarter to revenue between $1.083 billion-$1.087 billion vs. the $982 million market consensus. Management also discussed 2025 revenue coming in between $4.142 billion-$4.150 billion, compared to the $3.89 billion consensus. That implies roughly 20% top-line growth in H2 2025 compared to the first half. But keep in mind that the RPO figure was time-stamped June 30. On August 4, Palantir was awarded a 10-year enterprise agreement with the Army, totaling up to $10 billion, which consolidates 75 contracts into one that spans through 2035. Needless to say, that should do wonders for its RPO figures when it reports the current quarter. In the second half of August, PLTR shares returned to their pre-earnings level, closing the price gap in the chart created by the post-earnings pop in the stock. That action, along with PLTR once again hugging support at the 50-day moving average, led us to pick up additional shares for the Portfolio at 154.61 on August 20. Alongside that move, we also upped our rating on PLTR shares to One.
August Monthly Price Change: -1.0%; Yield: 0.0%
INVESTMENT THESIS: Palantir Technologies specializes in big data analytics and builds software platforms that help organizations integrate, analyze, and make sense of vast amounts of data for both commercial and government clients. While much has been made about the company’s exposure to the federal government, its software is used across 90 industries, and the larger global government sector accounted for 55% of revenue last year. The balance was from the commercial sector. Exiting Q2 2025, Palantir’s Commercial remaining deal value (RDV) stood at $2.8 billion, up from $1.79 billion exiting 2024. We will continue to monitor Palantir’s RDV and deferred revenue metrics, but in our view, key items to watch will be the continued diversification of its customer base across industries and increasing revenue per customer. Both have made considerable progress in H1 2025, with Commercial revenue reaching 58% of total revenue in Q2 2025. Because we are still in the relatively early innings of AI adoption, we are inclined to be long-term owners of PLTR shares.
Target Price: $200; Rating: Two
Panic Point: $115
RISKS: Economic and IT budget spending risk, technology risk, competition and competitive pressures, and customer acquisition risk.
Qualcomm Inc. QCOM; $160.73; 1,220 shares; 3.65%; Sector: Technology
UPDATE: August was a strong month for Qualcomm (QCOM) , with the increase of more than 9% pushing the shares into positive territory on a year-to-date basis. We chalk that performance up to a combination of factors, including favorable data points from Taiwan Semiconductor regarding smartphone and PC volumes in H2 2025, to Qualcomm’s multiple investor conference appearances. Each of those presentations spoke to the company’s diversification strategy that focuses on automotive, IoT, and the AI PC markets. Based on design wins, management confirmed Qualcomm remains on track to deliver $22 billion in combined automotive and IoT revenue by fiscal 2029. Part of that effort includes more than 100 AI PC designs being commercialized over the next 18 months with leading OEMs, such as Acer, Dell, HP, Lenovo, Microsoft, and Samsung. During HP’s recent earnings report, it saw double-digit sequential growth in its AI PC business, which led it to become more than 25% of HP’s revenue mix a quarter sooner than expected. Exiting August, research firm Gartner shared an updated AI PC market forecast, calling for it to represent 31% of the total PC market globally by the end of 2025 compared to 15.6% at the end of 2024. The one end market that we didn’t hear much about this month from Qualcomm was data center, a market Qualcomm will be entering following its pending acquisition of AlphaWave, which should close in Q1 2026. We see that being another leg to the Qualcomm revenue diversification stool, and one that could require some incremental investment next year. As Qualcomm’s revenue diversification strategy bears fruit, we expect to see Wall Street shift how it values QCOM shares. That is what we aim to capture with our position in QCOM, recognizing the revenue ramp could be lumpy over the next few years. Near-term, as we move deeper into the seasonally strongest time of year for Qualcomm’s business, should its shares move much past $165, we may need to revisit our One rating. Of course, if new data from the likes of Taiwan Semi or Foxconn gives us a reason to lift our price target, we’ll factor that into our thinking.
August Monthly Price Change: 9.5%; Yield: 2.2%
INVESTMENT THESIS: Qualcomm focuses on foundational technologies for the wireless industry, including 3G (third generation), 4G (fourth generation), and 5G (fifth generation) wireless technologies and processor technologies, including high-performance, low-power computing, and on-device artificial intelligence technologies. As a connected processor company, its technology roadmap aims to enable the connected intelligent edge (the next generation of smart devices) across industries and applications beyond handsets, including automotive and the Internet of Things (IoT). Qualcomm has three reportable segments: QCT (Qualcomm CDMA Technologies) semiconductor business, which develops and supplies integrated circuits and system software based on 3G/4G/5G and other technologies for use in mobile devices; automotive systems for connectivity, digital cockpit, and ADAS/AD; and IoT, including consumer electronic devices, industrial devices, and edge networking products. QCT accounts for 80%-85% of revenue. QTL (Qualcomm Technology Licensing) licensing business grants licenses or otherwise provides rights to use portions of the company's intellectual property portfolio, which includes certain patent rights essential to and/or useful in the manufacture and sale of certain wireless products. QTL accounts for ~15% of Qualcomm's revenue but contributes a greater portion of the company's operating income. Our focus on QCOM shares is revenue diversification as part of management's intended strategy to lessen its reliance on the smartphone market by tapping into the AI PC, IoT, and automotive chip markets. We see this unfolding over the next few years, which should lead Wall Street to revisit how it values the shares. It is that opportunity we aim to capture by owning the shares over the longer term.
Target Price: $180; Rating: One
Panic Point: $135
RISKS: Customer risk, technology advancement, competition risk, third-party supplier, and manufacturing partner risk.
ServiceNow NOW; $917.46; 215 shares; 3.67%; Sector: Technology
UPDATE: Along with other software stocks, shares of ServiceNow (NOW) struggled in August despite the company lifting its subscription revenue expectations when it reported its June-quarter results in mid-July. Backing that thinking, we saw a nice uptick in current remaining performance obligations (RPO) to $10.92 billion compared to $8.78 billion in the year-ago quarter. To that, we can add the $13 billion in noncurrent RPO, up 29% year over year, which puts its total RPO at almost $24 billion. We see that offering ample coverage for management’s revised subscription revenue outlook of $12.775 billion-$12.795 billion for this year. That equates to about 9% stronger revenue in H2 2025 compared to H1 2025, and even stronger growth compared to H2 2024. But the market overlooked that in August amid concerns of disruption from AI despite clear signs of accelerating enterprise AI adoption, which keeps Big Tech companies' capacity constrained, leading to higher capital spending levels in the second half of 2025. We took advantage of that misperception by picking up more NOW shares for the Portfolio at $877.52 on August 18. Toward the end of the month, upbeat earnings from Snowflake and others that offered further confirmation of AI adoption in the enterprise led NOW to rebound further. With AI adoption still relatively early innings and CIOs increasing their spending on AI, we will remain owners of NOW shares. The next known catalyst for NOW shares will be the management presentation at the Goldman Sachs Communacopia + Technology Conference on September 10. We have additional room to expand the Portfolio’s position in NOW, and if September’s market performance lives up to its reputation, we may get that opportunity.
August Monthly Price Change: -2.7%; Yield: 0.0%
INVESTMENT THESIS: The addition of ServiceNow adds exposure to the enterprise as it deploys AI-enabled solutions across its enterprise workflow platform. The company’s “Now Platform” is a cloud-based solution with embedded AI and machine learning (ML) capabilities that help unify and digitize workflows, driving productivity. At the heart of it, the company’s platform automates workflows across an entire enterprise by connecting disparate departments, systems, and silos in a seamless way to unlock productivity. ServiceNow counts more than 8,100 global customers, including 85% of the Fortune 500, with 97% of its revenue from subscriptions that have notched a 98% renewal rate. During the March 2025 quarter, ServiceNow also announced plans to acquire Moveworks, which offers front-end AI assistant and enterprise search technology, and Logik.ai, which provides AI-powered, and composable configure, price, and quote solutions for sales teams. We see these moves augmenting its offering and helping pave the way for further adoption of AI and subscription-based revenue.
Target Price: Reiterate $1,200; Rating: One
Panic Point: $825
RISKS: Industry and economic risk, competition and competitive pressures, and acquisition risk.
SuRo Capital SSSS; $8.70; 19,000 shares; 3.07%; Sector: Financial Services
UPDATE: Shares of SuRo Capital (SSSS) added to their July gains in August, leading them to outperform the S&P 500 during the first two months of the current quarter. As we lifted our SSSS price target to $10 from $9.25, we used the post-CoreWeave (CRWV) IPO lockup expiration to acquire additional SSSS shares for the Portfolio. That increased the potential price return for the Portfolio’s position enough to warrant an upgrade to a One rating. However, we would remind you that our SSSS play remains a total return one as SuRo continues to harvest its investment portfolio. Soon after we close the current quarter, we could see SuRo issue a preliminary update for its portfolio, which could include its next dividend announcement. That payment should reflect the monetization of SuRo’s holdings in CoreWeave and GrabAGun Digital Holdings (PEW). Exiting the June quarter, those two positions accounted for about 26% of SuRo’s investment Portfolio. PEW shares were listed on the NYSE on July 16. We would not be surprised if SuRo paces its dividend payments in H2 2025 and, if need be, trues up its dividend obligation with a special payment late in the year. While we enjoy the SuRo dividend stream, two items we will be closely following are other companies in its portfolio filing to go public and the company’s reinvestment decisions. The former will determine 2026 dividend payments, while the latter will lay the groundwork for dividend payments further out. Should we see indications that the SuRo dividend stream is waning, that would be a signal for us to reconsider owning SSSS shares in the Portfolio. Remembering the company’s BDC structure, we do not see that happening in the next few quarters.
August Monthly Price Change: 2.5%; Yield: 2.9%
INVESTMENT THESIS: SuRo Capital is a business development company (BDC) that invests in high-growth, venture-backed private companies. As SuRo monetizes those portfolio investments through either IPO or M&A transactions, it must pay out most of its earnings to shareholders in the form of dividends. What’s important to factor into our thinking is that SuRo’s strategy isn’t to hold public company investments but rather to monetize them following the lock-up expiration. Sometimes this can be immediate, and sometimes it can be in stages, but when that monetization occurs, it triggers dividend payments. And because a BDC must pay out at least 90% of its taxable income through dividends to shareholders, there is the possibility of a special dividend to hit that qualifying threshold late in the year. As we think about this, it means that we should focus on total return with SSSS, which is defined as capital gains in the shares plus dividends received while owning them. What this means is even if we see SSSS shares trade sideways or move lower, depending on the size of the dividend payments in the coming quarters, the position’s total return could still be sizable for the Pro Portfolio. SuRo portfolio holdings at the end of March included CoreWeave (CRWV), ServiceTitan (TTAN), OpenAI, Liquid Death, Whoop, and fintech company Plaid, as well as roughly 30 other holdings.
Target Price: $10; Rating: One
Panic Point: $7
RISKS: Industry and economic risk, competition and competitive pressures, and acquisition risk.
Universal Display OLED; $138.59; 1,388 shares; 3.58%; Sector: Technology
UPDATE: Shares of Universal Display (OLED) were a modest drag on the Portfolio’s August performance despite the growing number of positive data points about organic light-emitting diode display adoption. We chalk that up to concerns over tariff-related pull-forward demand for the smartphone market as well as other consumer electronic devices. Research firm Omdia continues to see higher organic light-emitting diode adoption ahead in smartphones, TV, and the automotive sector. That includes a wider array of foldable products, which are gaining traction with consumers. There was also fresh evidence that Apple will enter the foldable market in 2026, likely spurring others to follow. We see that as only part of the demand driver for organic light-emitting diode display, with others being notebook PCs, tablets, monitors, automotive lighting, and others. During management’s presentation at the Oppenheimer 28th Annual Technology, Internet & Communications Conference, part of the discussion centered on the company’s blue solution in more detail, indicating interest across multiple device categories, including smartphones, tablets, and other displays. On the topic of foldable smartphones, one we’ve been following rather closely, management commented about the larger opportunity, given that the needed volume of its red, green, and eventually blue materials is two to three times the volume of a standard smartphone. The same thinking applies to the tablet, PC, and other markets that have much larger display sizes compared to a conventional smartphone. We’ve been patient with OLED shares because the data points continue to point to rising adoption of organic light-emitting diode displays. We will continue to play the long game with this position as organic light-emitting diode adoption continues to rise across a wider array of end markets. To be clear, we are talking quarters, not months, for this to play out. For now, we’ll keep our OLED price target at $200, but as we get more confirming data points for that display technology adoption, we intend to revisit it. The next known catalyst for the shares will be management’s next presentation at the Citi 2025 Global TMT Conference on September 4. We will also continue to monitor comments and data for key end-market device demand.
August Monthly Price Change: -4.0%; Yield: 1.3%
INVESTMENT THESIS: Universal Display focuses on the development and commercialization of organic light-emitting diode (OLED) technologies and materials for use in display and solid-state lighting applications. OLED displays are capturing a growing share of the display market, especially in the mobile phone, television, monitor, wearable, tablet, notebook, personal computer, augmented reality (AR), virtual reality (VR), and automotive markets. This adoption reflects advantages over competing display technologies concerning power efficiency, contrast ratio, viewing angle, video response time, form factor, and manufacturing cost. Universal Display's business strategy is to develop new OLED materials and sell existing and new materials to product manufacturers for display applications, such as mobile phones, televisions, monitors, wearables, tablets, portable media devices, notebook computers, personal computers, and automotive applications, and specialty and general lighting products. The company also looks to license its OLED material, device design, and manufacturing technologies to those manufacturers. As such, Universal Display has a significant portfolio of proprietary OLED technologies and materials with more than 5,500 patents issued and pending worldwide.
Target Price: Reiterate $200; Rating: One
Panic Point: $135
RISKS: Patent and Intellectual property protection; maintaining OLED manufacturing and customer relationships; technology risk; market risk.
TWOS
Alphabet GOOGL; $212.91; 1,108 shares; 4.39%; Sector: Communication Services
UPDATE: In late July, following a massive run in Google (GOOGL) shares resulting in their overbought condition, we downgraded our rating to a Two. Over the last few weeks, the shares chugged further ahead, leaving them up roughly 20% quarter to date. We continue to see Google Cloud benefiting from enterprise cloud and AI adoption, especially as it integrates more AI agents into each of its cloud products. Per management, more than 85,000 enterprises, including LVMH, Salesforce, and Singapore's DBS Bank, now build with Gemini, driving a 35x growth in Gemini usage year-over-year. Impressive, but so is the cloud backlog figure of $106 billion discussed on the Q2 2025 earnings call. That should allow for continued revenue growth even as the segment passed the $50 billion annual run rate figure in the June quarter. Meanwhile, the company continues to make strides in integrating its Gemini model in Search, Android, and other areas, which confirms our view that Google remains a player in the AI space, especially when it comes to consumer adoption. Google also remains well-positioned with YouTube and that advertising revenue stream as streaming continues to take share from cable and broadcast advertising dollars. The next known catalyst for GOOGL shares will be the presentation by Thomas Kurian, CEO, Google Cloud, at the Goldman Sachs 2025 Communacopia + Technology Conference on September 9. Based on what we learn in that presentation, as well as other data points, we’ll revisit our current $220 price target as needed.
August Monthly Price Change: 10.9%; Yield: 0.4%
INVESTMENT THESIS: We believe that while search and digital ad dominance are what will carry the shares in the near-to mid-term, longer-term, it is the company's artificial intelligence "moat" that will provide for new avenues of growth. Exiting the March 2025 quarter, Alphabet reported over 270 million paid subscriptions across YouTube and Google One. YouTube Music and Premium alone reached 125 million subscribers globally. AI is what has made the company's search, video, and targeted ad capabilities best-in-class and is the driving force behind the company's success in voice (Google Home) and autonomous driving (Waymo). Furthermore, we believe it is this AI expertise that will also make the company more prevalent in other industries, including healthcare via its subsidiary Verily, as AI and machine learning continue to disrupt operations across industries. Exiting the March 2025 quarter, across all its products, Alphabet had 0.5 billion users using its Gemini models. Adding to our positive view of the company's future opportunities, we believe that Alphabet's free cash flow generation and solid balance sheet set it apart and are what will allow the company to continue taking chances on far-out, ground-breaking, and potentially world-changing projects, as well as fund capital returns to shareholders. We will continue to monitor advertising spend as well as the competitive landscape for the company’s core Search and Advertising business.
Target Price: Reiterate $220; Rating: Two
Panic Point: $155
RISKS: Regulatory risk (data privacy), competition, and macroeconomic slowdown impacting consumers and therefore ad buyer activity.
American Express AXP; $331.28; 640 shares; 3.94%; Sector: Financial Services
UPDATE: Following American Express’s (AXP) June-quarter results, we increased our AXP target to $340 from $310, and shortly thereafter, we picked up additional shares for the Portfolio near $308 on July 21. That proved to be a prudent move given the more than 10% move in the stock during August. We will continue to monitor consumer spending, but in our view, the larger catalyst will be Amex’s Platinum card refresh later this year and its potential impact on average fee per card and the number of cards in force. We say this because, as we saw in Q2 2025, net card fee revenue accounted for 70% of Amex’s pre-tax income in H1 2025, up from 58% in H1 2024. We think the company’s outlook for H2 2025 could be conservative given trends in average fees per card, which should be nicely higher year over year in H2 2025. Spending has also held up better than expected, and as we know, consumer spending tends to be skewed to H2 2025 given multiple holidays. Amex management will present at the Barclays Global Financial Services Conference on September 9. While we expect some fresh color on the business, we doubt that it will be the venue at which Amex unveils its Platinum card refresh. As we enter September, a month that tends to be a challenging one for the market, if AXP pulled back near $309, that would be a nice place to pick up additional shares. A more compelling level and one that would lead us to revisit our Two rating would be near $293. In the meantime, AXP is likely to be supported by Amex’s share repurchase program, which, exiting June, had ~68 million shares left under its current authorization, roughly 10% of its outstanding shares.
August Monthly Price Change: 10.7%; Yield: 1.0%
INVESTMENT THESIS: American Express is a globally integrated, membership-driven payments company, providing customers with access to products, insights, and experiences that enrich lives and build business success. The company has four reportable operating segments: U.S. Consumer Services (USCS), Commercial Services (CS), International Card Services (ICS), and Global Merchant and Network Services (GMNS). American Express targets the premium consumer space by continuing to deliver membership benefits that span our customers’ everyday spending, borrowing, travel, and lifestyle needs, expanding its roster of business partners around the globe, and developing a range of experiences that attract high-spending customers. In 2024, the company’s net card fee revenue accounted for 65% of its pre-tax income, which we see providing a differentiated business model that should continue to grow as Amex wins new card members and drives its average fee per card higher.
Target Price: Reiterate $340; Rating: Two
Panic Point: $275
RISKS: Slowdown in consumer spending, competition, membership growth, merchant acceptance, and lack of new product innovation.
Apple AAPL; $232.14; 825 shares; 3.56%; Sector: Technology
UPDATE: Shares of Apple (AAPL) were one of the Portfolio’s top performers in August with their low double-digit gain. That strong move, which began with the market’s reaction to Apple’s better-than-expected June-quarter results reported on July 31, has them quickly approaching our $235 target. In that quarterly earnings report, much was said about better-than-expected iPhone sales, but in our view, the shining star was Apple’s higher-margin Services revenue, which accounted for 29% of sales in the quarter but more than 47% of its overall gross profit dollars, up from 45% in the March 2025 and June 2024 quarters. Helping drive that positive mix shift was Apple’s install base of active devices, which reached another all-time high across all product categories and geographic segments. With the iPhone install base still aging, one of the key plays with Apple shares is the upgrade cycle, which increasingly looks more like a 2026 event. That is when Apple is expected to deliver the much-awaited AI-enhanced Siri and, increasingly, its foldable iPhone. This suggests Apple’s upcoming event on September 9 is likely to reveal modest upgrades for iPhone and other products. Another growing thought is that we could see higher price tags for the models as Apple factors in the impact of tariffs. One catalyst that could spark renewed interest in the iPhone upgrade cycle would be if Apple announced a partnership to power that expected Siri upgrade. Between now and Apple’s September event, we have August revenue reports from Taiwan Semiconductor and Foxconn, as well as several investor conference comments to sift through. Based on those learnings and what they could indicate for iPhone volumes, we’ll revisit our AAPL target as needed.
August Monthly Price Change: 11.8%; Yield: 0.5%
INVESTMENT THESIS: While we acknowledge that near-to-midterm performance remains heavily influenced by iPhone sales, the dynamic is shifting as investors finally place greater emphasis on Services growth. We are bullish on the 5G upgrade cycle and believe longer-term upside will continue to come as Services revenue grows its share of overall sales. Services provide for a recurring revenue stream at higher margins, a factor that serves to reduce earnings volatility while allowing for a higher percentage of sales to fall to the bottom line; as a result, we believe that Services growth and the installed base are much more important than how many devices the company can sell in each 90-day period. In addition to improved profitability, we also believe the transparent nature of this revenue stream will demand an expanded price-to-earnings multiple as segment sales grow. Furthermore, we believe that Apple's desire to push deeper into the healthcare arena will help make its devices invaluable as more life-changing features are added and the company works to democratize health records.
Target Price: Reiterate $235; Rating: Two
Panic Point: $180
RISKS: Slowdown in consumer spending, competition, lack of new product innovation, elongated replacement cycles, and failure to execute on Services growth initiatives.
Axon Enterprise AXON; $747.29; 263 shares; 3.65%; Sector: Aerospace & Defense
UPDATE: Shares of Axon (AXON) were a little changed in August, but that masks the multiple moves we made during the month with this holding. Following the company’s better-than-expected June-quarter earnings report that led us to boost our price target but also popped the shares amid a wave of short-covering, we opted to take some AXON chips off the table at $877 on August 6. As we noted at the time of that trade, while we continue to like the company’s mix shift toward the higher-margin Software and Services segment, which should continue in the coming quarters, with the shares above our revised price target of $860, we opted to lock in a slice of the more than 80% gain since their early April low. Following that trade, AXON shares came under pressure over the ensuing weeks in a move that tallied more than a double-digit fall. Recognizing the power of the continued mix shift in its business and the prospects for AI adoption to boost its recurring revenue stream, we took advantage of that pullback to buy back more shares than we sold on August 6. For us, the Axon story continues to be one centered on the mix shift toward the higher-margin, recurring revenue services business, as well as continued growth for its hardware business in federal, corporate, and international markets. In H2 2025, we should see AI take a larger role in driving that shift, and it should also foster further growth in several key metrics that we track for the company. The next known catalyst for these shares will be management’s presentation at the Goldman Sachs Communacopia & Technology Conference on September 9.
August Monthly Price Change: -1.1%; Yield: 0.0%
INVESTMENT THESIS: Axon Enterprise develops, manufactures, and sells conducted energy devices and cloud-based digital evidence management software designed for use by law enforcement, corrections, military forces, private security personnel, and private individuals for personal defense. The company operates in two segments: Taser (recently renamed Connected Devices) and Software & Sensors (recently renamed Software & Services). Taser develops and sells CEDs used for protecting users and virtual reality training. Software & Sensors manufactures fully integrated hardware and cloud-based software solutions such as body cameras, automated license plate reading, and digital evidence management systems. Axon delivers its products worldwide and gets most of its revenue from the United States. According to Mordor Intelligence, the wearable and body-worn cameras market on its own was valued at $1.62 billion in 2020 and is expected to reach $424.63 billion by 2026. Public safety organizations are increasingly adopting cloud solutions, leading to significant spending in this area. The digital spending in public safety is projected to reach $201 billion by 2027.
Target Price: Reiterate $860; Rating: Two
Panic Point: $650
RISKS: Manufacturing and supply chain, competitive factors, government regulation, and technology change.
Bank of America Corp. BAC; $50.74; 4,410 shares; 4.16%; Sector: Financial Services
UPDATE: After treading water in July, shares of Bank of America (BAC) heated up in August, climbing more than 7%, pushing their year-to-date return ahead of the S&P 500. Following the outcome of the 2025 Fed stress tests and the increase in BofA’s quarterly dividend to $0.28 per share, we boosted our BAC price target to $55. Based on the company’s June-quarter earnings report and guidance, we saw no reason to change that target. However, as we discussed multiple times in August, should investment banking activity continue to heat up, it would give us a reason to revisit our BAC price target. With a resurgence in the IPO market expected to emerge in the coming weeks, with offerings from Klarna, cybersecurity company Netskope, Figure Technologies, and e-commerce firm Patton Group, that revisit could happen in the coming weeks. We will also continue to follow the domestic economy and interest rates to monitor the tone of BofA’s commercial banking business. This week, the American Bankers Association, the Bank Policy Institute, and the Consumer Bankers Association are asking the U.S. Office of the Comptroller of the Currency to create national standards for banking services that would take precedence over state banking rules. One other item we’ll be watching is the follow-through from the GENIUS Act and whether BofA does more than explore stablecoin initiatives.
August Monthly Price Change: 7.3%; Yield: 2.2%
INVESTMENT THESIS: Bank of America is one of the world's leading financial institutions, serving individual consumers, small and middle-market businesses, and large corporations with a full range of banking, investing, asset management, and other financial and risk management products and services. The company provides unmatched convenience in the United States, serving approximately 67 million consumers and small business clients with approximately 3,900 retail financial centers, approximately 16,000 ATMs, and award-winning digital banking with approximately 56 million verified digital users. Bank of America is a global leader in wealth management, corporate and investment banking, and trading across a broad range of asset classes, serving corporations, governments, institutions, and individuals around the world. Bank of America offers industry-leading support to approximately 3 million small business households through a suite of innovative, easy-to-use online products and services. The company serves clients through operations across the United States, its territories, and approximately 35 countries. From a reporting perspective, the company's business breaks down as follows: Net Interest Income breakdown: Consumer Banking 57%, Global Banking 23%, Global Wealth & Investment Management 14%, and Global Markets 6%; Income Before Tax breakdown: Consumer Banking 42%, Global Banking 27%, Global Wealth & Investment Management 16%, and Global Markets 15%. Bank of America pays a quarterly dividend of $0.26 per share, up from $0.18 a few years ago.
Target Price: $55; Rating: Two
Panic Point: $39
RISKS: Financial markets, fiscal, monetary, and regulatory policies, economic conditions, and credit ratings.
Dutch Bros BROS; $71.83; 2,925 shares; 3.91%; Sector: Consumer Cyclical
UPDATE: Following back-to-back declines in June and July, shares of Dutch Bros (BROS) roared back in August, soaring nearly 20%. That made BROS the Portfolio’s top performer during the month, and us very glad we opted to pick up more shares at $59.27 in late July. Following the company’s beat-and-raise quarterly earnings on August 7, we reiterated our $85 target. Management also reiterated its 2,029 total shop count target for 2029. During the June quarter, Dutch Bros opened 31 new system locations, expanding into its 19th state (Indiana). That put the company’s total system count at 1,043 compared to 982 exiting 2024. Based on management’s target of at least 160 new shops this year, we should see roughly 100 shops open in H2 2025. Applying some simple math, if Dutch Bros exits 2025 with a shop count near 1,142, that means the pace of openings will need to accelerate in 2026 and 2027 to hit its 2,029 shop count by 2029. To us, the footprint expansion with the added layering of an expanded food offering starting next year points to continued revenue, profit dollars, and EPS growth. That keeps us bullish on BROS shares, and if margins hold up better than expected in H2 2025, that would give us a reason to revisit our price target. One knock that we’ve identified is the lack of communication from the management team, which can make the shares volatile at times. Until the management team decides to call more attention to its footprint expansion, we’re willing to put up with fluctuations in BROS shares so long as that footprint expansion story remains intact.
August Monthly Price Change: 21.2%; Yield: 0.0%
INVESTMENT THESIS: Dutch Bros is an operator and franchisor of drive-thru shops that focus on serving high-quality, hand-crafted beverages with unparalleled speed and superior service. Coffee-based beverages make up ~50% of the menu mix, and ~25% of the menu mix is based upon the company’s proprietary Blue Rebel energy drink, which is highly customizable with flavors and modifiers and can be served blended or over ice. The energy platform helps unlock the afternoon daypart and broadens the company’s appeal. The remaining 25% of the menu mix is a wide variety of teas, lemonades, sodas, and smoothies. The company’s west-to-east expansion is a time-tested strategy that should drive revenue and EPS growth over the next several years. Leveraging that footprint expansion and low-single-digit comp sales growth, management reiterated its long-term guidance of around 20% annual revenue growth. Helping support that guidance, the company confirmed it will introduce an expanded food menu in 2026. Dutch Bros is slated to enter the consumer-packaged goods (CPG) space in a deal with Trilliant Food & Nutrition.
Target Price: Reiterate $85; Rating: Two
Panic Point: $50
RISKS: Commodity risks, labor costs, interest rate risk, and inflation.
First Trust Nasdaq Cybersecurity ETF CIBR; $73.14; 2,248 shares; 3.06%; Sector: Cybersecurity
UPDATE: Each time we note ripped-from-the-headlines confirmation points for the Pro Portfolio and its underlying strategy, one constant is the signals for cybersecurity demand. Artificial intelligence will super-charge familiar threats in 2025 and beyond, putting new wrinkles on old security challenges such as phishing, insider threats, and ransomware. Entering this year, research firm Gartner expected cybersecurity spending would rise $212 billion, but this week the firm increased that to $213 billion. It also forecasts cybersecurity spending accelerating in 2026 as it sees a concerted enterprise effort to shore up cloud security capabilities, particularly in relation to AI workloads. That upsized outlook, along with the post-earnings selloff in shares of Check Point Software following its "beat-and-reiterate" quarter, as well as the move lower in Palo Alto Networks after its formal takeover announcement of CyberArk Software, led us to pick up additional (CIBR) shares at the end of July. As we made that move, we also upped our CIBR target to $85 from $78. We will still have ample room to expand the Pro Portfolio’s exposure to CIBR should we see a wider market pullback emerge during September. If such an event unfolded, CIBR shares near $69 would make for a wonderful addition, which also happens to be our established pick-up point. For now, our $63 panic point remains, but as CIBR shares move higher, we’ll lift that level in a commensurate manner. Catalysts we will be watching include subsequent M&A activity in the space as well as quarterly results and guidance from remaining CIBR holdings in the coming days. To that list, we can add updated H2 2025 comments from top CIBR holdings at upcoming investor conferences.
August Monthly Price Change: 0.6%; Yield: 0.02%
INVESTMENT THESIS: The First Trust Nasdaq Cybersecurity ETF seeks investment results that correspond generally to the price and yield (before the fund's fees and expenses) of an equity index called the Nasdaq CTA Cybersecurity Index. The Nasdaq CTA Cybersecurity Index is designed to track the performance of companies engaged in the cybersecurity segment of the technology and industrial sectors. It includes companies primarily involved in the building, implementation, and management of security protocols applied to private and public networks, computers, and mobile devices to protect the integrity of data and network operations. To be included in the index, a security must be listed on an index-eligible global stock exchange and classified as a cybersecurity company as determined by the Consumer Technology Association. Each security must have a worldwide market capitalization of $250 million, have a minimum three-month average daily dollar trading volume of $1 million, and have a minimum free float of 20%.
Target Price: Reiterate $85; Rating: Two
Panic Point: $63
RISKS: Cybersecurity spending, technology, and product development, the timing of the product sales cycle, new products, and services in response to rapid technological changes and market developments, as well as evolving security threats.
Labcorp Holdings Inc. LH; $277.99; 710 shares; 3.67%; Sector: Healthcare
UPDATE: August was a quiet month news-wise for Labcorp (LH) , but the shares continued to power ahead, expanding their year-to-date lead over the S&P 500. We chalk up that superior performance to Labcorp continuing to execute on its strategy to integrate acquired businesses, expand its footprint, and reap the benefit of cost synergies, while also growing its diagnostics capabilities. While it may not be a sexy business or one that generates much in the way of headlines, the company remains a well-positioned play for our Aging of the Population investing theme. Exiting the June quarter, Labcorp’s trailing 12-month orders accelerated to $3.34 billion, up from $3.15 billion three months earlier, leaving its total backlog at $8.71 billion compared to $8.18 billion. That, along with some additional nip-and-tuck acquisitions completed in July, including acquiring select assets of the outreach business from Community Health Systems across 13 states, backs management's raised outlook for 2025. Management now sees its top line rising 7.5%-8.6% year over year, compared to 6.7%-8.0% at the end of March. That increase and continued margin improvement prospects led us to boost our LH price target to $300 from $265 back in mid-July. When competitor Quest Diagnostics presents at the Baird 2025 Global Healthcare Conference on September 10, we’ll be looking for further support for our LH price target. We see support near $260 for the shares, but when we examine the chart more closely, we see a late August gap that, if closed near $255, would bring a more favorable risk-to-reward pick-up point. With just under 3.7% of the Portfolio’s assets in LH shares, a pullback to that level could lead us to round out that position size.
August Monthly Price Change: 6.9%; Yield: 1.1%
INVESTMENT THESIS: Labcorp is a global leader in innovative and comprehensive laboratory services that provide vital information to help doctors, hospitals, pharmaceutical companies, researchers, and patients make clear and confident decisions. By leveraging its diagnostics and drug development capabilities, the company provides insights and accelerates innovations to improve health and improve lives. The company is organized under two segments, consisting of Diagnostics Laboratories (Dx), which includes routine testing and specialty/esoteric testing, and Biopharma Laboratory Services (BLS), consisting of Early Development Research Laboratories and Central Laboratory Services. Our attraction to LH shares stems from the combination of the aging population driving diagnostic testing growth and the increasing array of diagnostic testing as well. That combination is expected to drive the healthcare testing services market to $12.6 billion by 2029, from $7.4 billion in 2024, according to Markets and Markets. To augment its position in oncology, women's health, autoimmune diseases, and neurology, the company has been expanding through acquisitions and partnerships with health systems and regional, local labs.
Target Price: Reiterate $300; Rating: Two
Panic Point: $228
RISKS: Macroeconomic factors, changes in healthcare reimbursement models and products, government regulations, product discontinuations or recalls.
Meta Platforms META; $738.70; 283 shares; 3.89%; Sector: Communication Services
UPDATE: Meta (META) shares were a modest drag on the Portfolio during August, but even after that performance, the shares remain up more than 20% year-to-date. Because we are still in the early innings of Meta’s leveraging AI to drive pricing, productivity, and margins higher, which suggests more benefits to come in subsequent quarters, we will remain META owners to capture further gains. While many were in awe of the company’s June-quarter top- and bottom-line beats on July 31, which were impressive, the year-over-year 500-basis point improvement in its consolidated operating margin was what really jumped out at us. We should see further improvement in the second half of 2025, but higher expenses will be a headwind as Meta invests further in AI capacity and talent. However, we see this as another instance of the company investing today to drive its business and profits higher in the coming quarters. Part of that includes the further expansion of its ad platform to include WhatsApp and, to a larger extent, Threads, but also increasing AI’s role in automating and streamlining its larger advertising revenue stream. Per management, we are in the early innings of those strategies, and that suggests more benefits to come in subsequent quarters. We read that as greater profit and EPS dollars ahead, and that will keep us invested in META shares. We will continue to monitor digital ad spending, Meta’s monetization efforts, and the impact of internal AI adoption on margins. Based on what we learn, we will revisit our price target as needed. The next known catalyst for META shares will be the company’s Connect 2025 event on September 17-18. On September 17, Mark Zuckerberg will deliver a keynote addressthat is expected to focus on AI glasses and lay out Meta’s vision for artificial intelligence and the metaverse.
August Monthly Price Change: -4.5%; Yield: 0.3%
INVESTMENT THESIS: Meta segments its business between Family of App Products, which includes Facebook, Instagram, Messenger, Threads, and WhatsApp, and Reality Labs Products, which includes its metaverse and investments and future product R&D. Family of Apps accounts for ~99% of company revenue and 100% of company operating profit. Substantially all of Meta’s revenue is currently generated from advertising on Facebook and Instagram. Family daily active people (DAP) were 3.48 billion on average for the June 2025 quarter. Meta expects to spend $66 billion to $72 billion on capex in 2025, a significant increase year over year, with most of this spending focused on AI infrastructure and initiatives. Meta is positioned to benefit from the ongoing shift toward digital advertising and the adoption of AI across its product offerings. We recognize Meta is ramping up capital spending as part of the current AI arms race, but we see that as an investment that should drive productivity in its core advertising business. As the company harvests that investment, we could see a step up in margins, much like we saw in 2023.
Target Price: $850; Rating: Two
Panic Point: $625
RISKS: Ability to add and retain users and user engagement; marketing spend; new products or changes to existing ones; competitive risk, geopolitical risk.
Microsoft Corp. MSFT; $506.69; 370 shares; 3.49%; Sector: Technology
UPDATE: Following a strong move in July, shares of Microsoft (MSFT) gave most of that gain back in August but still managed to contribute to the Portfolio’s overall August move higher. In keeping with our Two rating and our $600 price target, we are evaluating levels at which we would put capital to work as the company continues to monetize its ramping cloud capacity, grow its subscription revenue base, and benefit from the accelerating mix shift to AI PCs. Recognizing next week’s potential August data implications and the market’s skittish tendency in September, we’ll pick our spots carefully. Backing our view to consider adding more shares, the company’s commercial booking moved past $100 billion for the first time in the June quarter. That was a 37% year-on-year increase, but it was only part of the story. The company’s commercial remaining performance obligation (RPO) ballooned 35% to $368 billion. Quite impressive, but it was the comment made during the earnings call that roughly 35% of that RPO figure will be recognized as revenue in the next 12 months that really caught our attention. The next known catalyst for MSFT shares will be management’s presentation at the Goldman Sachs Communicopia & Technology Conference on September 10.
August Monthly Price Change: -5.0%; Yield: 0.7%
INVESTMENT THESIS: We believe the cloud to be a secular growth trend and that the upside to the shares will result from Microsoft's hybrid cloud leadership as the company grabs market share in this expanding industry. While companies may look to build out multi-cloud environments, Microsoft's Azure offering will be a prime choice thanks to its decision to provide the same "stack" used in the public cloud to companies for their on-premises data centers. Additionally, we would note that hybrid environments are currently the preference for most companies because they allow them to maintain critical data in-house while taking advantage of the agility and scalability provided by public clouds. Outside of the cloud opportunity, we maintain a positive view on the company's growing gaming business, which we believe is becoming an increasingly prominent factor in the Microsoft growth story as gaming becomes more mainstream, management works to convert its gaming revenue from a one-time license purchase to a recurring subscription model, and as technologies like augmented/virtual reality evolve. Finally, as it relates to LinkedIn and other subscription-based services such as O365 and various Dynamics products, we continue to value them highly for their recurring revenue streams, which, we remind members, provide for greater transparency of future earnings.
Target Price: $600; Rating: Two
Panic Point: $450
RISKS: Slowdown in IT spending, competition, and cannibalization of on-premises business by the cloud.
Morgan Stanley MS; $150.48; 1,462 shares; 4.09%; Sector: Financial Services
UPDATE: As investment banking activity heated up in Q2 2025, so too did our shares of Morgan Stanley (MS) , a nod to the financial leverage associated with that side of the business. Coming into July, we lifted our price target to $150 following MS once again successfully passing the Fed’s latest round of stress tests and announcing an 8% increase to its quarterly dividend. While MS shares were little changed in the first month of the current quarter, they re-accelerated in August, leaving them up a high-teens percentage on a year-to-date basis. With investment banking pipelines at Morgan Stanley and BofA being robust, we are inclined to remain owners of those shares to capture the incremental earnings leverage as that pipeline of IPO, M&A deals, and advisory assignments converts into transaction revenue and fees. The continued strength in MS shares has them on the cusp of our $150 target. With a resurgence in the IPO market expected to emerge in the coming weeks, with offerings from Klarna, cybersecurity company Netskope, Figure Technologies, and e-commerce firm Patton Group, we intend to revisit our current $150 target for MS shares. Should we see another wave of M&A transactions, that would bring more support for such a move. With a position size near 4% of the Portfolio’s assets, we’re not inclined to add more shares. For those whose position size is less than the Portfolio’s, we currently see a compelling risk-to-reward entry point near $130. Dan Simkowitz, Co-President of Morgan Stanley, will speak at the Barclays Global Financial Services Conference on September 10.
August Monthly Price Change: 5.6%; Yield: 2.7%
INVESTMENT THESIS: Morgan Stanley reports in three business segments: Institutional Securities (42% of trailing 12-month revenue, 38% of trailing 12-month Income Before Tax), Wealth Management (48%, 55%), and Investment Management (10%, 6%). While the IPO window has yet to reopen, the potential IPO class for 2025 continues to build with recent additions including Klarna and StubHub. That would be a boon to private equity firms and others that have been nursing IPO candidates during the dark period and a positive for Morgan Stanley's investment banking business. Expected deregulation under the Trump administration is a potential catalyst for Morgan's M&A business. Meanwhile, folks continuing to be behind in retirement savings bodes well for Morgan Stanley's wealth management business in the coming quarters, while continued market volatility bodes well for its equity trading business.
Target Price: $150; Rating: Two
Panic Point: $120
RISKS: Market and interest rate risk, credit risk, country risk, and operational risk, including cybersecurity.
TJX Companies TJX; $136.61; 687 shares; 1.75%; Sector: Financial Services
UPDATE: Our position in the shares of TJX Companies (TJX) that we began on July 1 started slow out of the gate, but their August performance more than made up for that. Quarter to date, TJX shares are up in the high single digits and well ahead of the S&P 500. Over the course of the quarter, we continued to receive signals that the consumer was becoming increasingly selective when it came to spending, opting to cut back on spending and switching to lower-priced products. That led us to boost our TJX price target to $140 in mid-August, but we lifted that target to $150 following TJX’s beat-and-raise July-quarter results. We continue to see TJX as well-positioned with consumers feeling the pinch of higher prices and remaining selective and value-driven, even though they will spend where it matters. During the July-quarter earnings call, management commented that the current quarter is off to a strong start, which, given other retailer earnings this past week, implies further market-share gains. On the topic of tariffs, TJX management reminded that around 90% of what it buys is from third parties, taking advantage of closeouts from brands, manufacturers, and other retailers, or in some cases, manufacturing overruns. As such, for around 90% of its merchandise, TJX is not the direct importer, and that makes the TJX business model different than most retailers. That combination sets the company up rather well from a value-driven consumer perspective as we head into the holiday shopping season. As we move deeper into H2 2025, toward the holiday shopping season, we would welcome the opportunity to boost the Portfolio’s exposure to TJX, but in keeping with our Two rating, we will remain disciplined investors. Recognizing that September tends to be a challenging month for the market, we see a gap in the chart that would be filled at $134, but also very strong support with the 50-day and 100-day moving averages converging near $128.
August Monthly Price Change: 9.7%; Yield: 1.2%
INVESTMENT THESIS: The TJX Companies is the leading off-price apparel and home fashions retailer in the United States and worldwide. It has over 5,000 stores and six branded e-commerce sites that offer a rapidly changing assortment of quality, fashionable, brand-name, and designer merchandise at prices generally 20% to 60% below full-price retailers’ regular prices on comparable merchandise. The company operates in four segments: Marmaxx and HomeGoods, both in the US, TJX Canada, and TJX International. TJX looks to capitalize on opportunities to acquire merchandise at substantial discounts that regularly arise from the production and flow of inventory in the apparel and home fashions marketplace. These opportunities include, among others, closeouts from brands, manufacturers, and other retailers; special production direct from brands and factories; order cancellations and manufacturer overruns. We see that positioning TJX extremely well, as consumers feel the pinch of ongoing inflation pressures and their efforts to stretch the disposable spending dollars they do have, including tapping discounted shopping locations.
Target Price: $150; Rating: Two
Panic Point: $115
RISKS: Operational, strategic buying, and competitive risks, as well as consumer spending patterns.
United Rentals URI; $956.34; 235 shares; 4.18%; Sector: Industrials
UPDATE: Shares of United Rentals (URI) have been a strong performer for the Portfolio throughout 2025. In August, the shares continued to climb, building on their more than 17% move higher in July, putting them well above the S&P 500 on a quarter-to-date and year-to-date basis. That continued strength has URI shares quickly approaching our $950 price target. We continue to see the company benefiting from nonresidential construction activity, due in part to data center construction as well as that for re-shoring efforts. Our plan is to revisit our price target once we have the July Construction Spending report and early September investor conference presentation comments in hand. A pullback to the 50-day moving average at $828 would give us sufficient upside to revisit our Two rating. However, because we are in the sweet spot for construction activity, the odds of the share retreating to that level near-term are likely rather low.
August Monthly Price Change: 8.3%; Yield: 0.8%
INVESTMENT THESIS: United Rentals, the largest equipment rental company in the world, operates throughout the United States and Canada, and has a limited presence in Europe, Australia, and New Zealand. It serves industrial and other non-construction, commercial (or private non-residential) construction, and residential construction. Industrial and other non-construction rentals represented approximately 50% of rental revenue, primarily reflecting rentals to manufacturers, energy companies, chemical companies, paper mills, railroads, shipbuilders, utilities, retailers, and infrastructure entities; commercial construction rentals represented approximately 46% of rental revenue, primarily reflecting rentals related to the construction and remodeling of facilities for office space, lodging, healthcare, entertainment, and other commercial purposes; and residential rentals around 4% of revenue. We see the company benefiting on three fronts — the seasonal uptick in construction spending, the release of funds and projects associated with the five-year Biden Infrastructure bill, data center construction and other reshoring projects, and the company's nip-and-tuck acquisition strategy that should further enhance its geographic footprint.
Target Price: Reiterate $950; Rating: Two
Panic Point: $680
RISKS: Industry and economic risk, competition and competitive pressures, and acquisition risk.
Vulcan Materials Company VMC; $291.16; 613 shares; 3.32%; Sector: Building Materials
UPDATE: Shares of Vulcan Materials (VMC) continued to gain ground in August, building on their July gains. That combination, which results in a low double-digit move quarter to date, means the shares have meaningfully outperformed the S&P 500 so far in the current quarter. We see further upside ahead as the company continues to realize margin and bottom-line benefits from higher year-over-year gross profit per ton metrics in H2 2025 and 2026. Normally, the second half of the year drives more than half of Vulcan's annual sales and 53%-55% of its adjusted EBITDA for the year. Given the inclement weather experienced in H1 2025, we are likely to see H2 2025 account for a larger-than-usual piece of annual revenue as catch-up activity is augmented by new highway construction and other drivers of non-residential construction activity, including data center. In our June-quarter earnings wrap-up Alert, we noted that if VMC shares moved closer to our $310 price target, we would consider revisiting our rating. Subsequent share price strength led us to downgrade VMC shares to a Two rating on August 11. While we see a gap in the chart near $275, which would offer a low double-digit return, a more compelling point of entry would be after a successful test of the 100-day moving average near $267. We will continue to evaluate incoming data, including the upcoming July Construction Spending report, as it relates to our price target and rating, but should we see VMC shares continue to chug higher, prudent action may be called for.
August Monthly Price Change: 6.0%; Yield: 0.7%
INVESTMENT THESIS: Vulcan Materials operates primarily in the U.S. and is the nation's largest supplier of construction aggregates (primarily crushed stone, sand, and gravel), a major producer of asphalt mix and ready-mixed concrete, and a supplier of construction paving services. Its products are the indispensable materials used in building homes, offices, places of worship, schools, hospitals, and factories, as well as vital infrastructure, including highways, bridges, roads, ports and harbors, water systems, campuses, dams, airports, and rail networks. Ramping spending associated with the Biden Infrastructure Law should drive demand for Vulcan's products over the coming years. Vulcan has historically complemented its organic growth prospects by acquiring businesses to expand its geographic reach and product scope. Since 2014, the company has acquired more than two dozen companies, including the 2021 acquisition of U.S. Concrete. That combination has allowed the company to deliver steady top and bottom-line growth over the last decade, with only a modest decline when the pandemic hit in 2020.
Target Price: Reiterate $310; Rating: Two
Panic Point: $240
RISKS: General economic and business conditions; dependence on the construction industry; timing of federal, state, and local funding for infrastructure; changes in the level of spending for private residential and private nonresidential construction.
Waste Management WM; $226.39; 720 shares; 3.03%; Sector: Industrials
UPDATE: During August, we made our latest move with Waste Management (WM) shares, adding to the Portfolio’s position at $225.06 mid-month following the pullback from over $237. That move also bolstered the Portfolio’s dividend income stream. We continue to favor the company’s sticky residential waste business, which is benefiting from disciplined pricing and further automation efforts, especially as it completes other nip-and-tuck acquisitions. We also like the company’s move into the medical waste business, and we see the team replicating the consolidation and margin-enhancing strategies that have been a hallmark of the waste business. Near-term, those prospects will be driven by pricing actions taken in the core waste removal business and further automation across its residential fleet. Management also sees quicker progress integrating WM Healthcare Solutions (the former Stericycle business) and now sees realized synergies toward the upper end of its $80 million-$100 million target for this year. While we do not build acquisitions into our expectations, as new ones are announced and subsequently integrated, we’ll reflect that in our WM price target. With support for WM shares at $224.40, the 200-day moving average, we may be inclined to revisit our Two rating based on what we hear when Waste presents at the Jefferies Industrials Conference following the Labor Day holiday weekend.
August Monthly Price Change: -1.2%; Yield: 1.5%
INVESTMENT THESIS: 2025 will see more nonresidential construction activity as the impact of the Biden Infrastructure Law, data center construction, and reshoring efforts are felt. Other potential drivers include spending associated with the Inflation Reduction Act. Alongside that bright outlook for WM's commercial business, automation efforts and pricing power in its sticky residential business should drive margins and EPS generation higher in the coming quarters. Given the fragmented nature of the North American waste and recycling industry, we see ample room for Waste Management to grow its footprint via nip and tuck acquisitions. As it does that, management’s track record of integrating acquired businesses and wringing out costs bodes well for further profit growth. We are in the early days of WM Healthcare Solutions, but we see the business growing as management integrates and cross-sells against its core business and flexes the ability to integrate nip-and-tuck acquisitions as it has at the core waste business. Here, too, we see room to consolidate a fragmented industry, which makes this a natural fit for Waste Management.
Target Price: $255; Rating: Two
Panic Point: $215
RISKS: Industry and economic risk, competition and competitive pressures, and acquisition risk.
