You Wouldn't Know the Nasdaq Has Been So Strong if You Only Looked at the Indicators
While the Nasdaq has been off to the races, the indicators are suggesting anything but aces.
You've reached your free article limit
You've read 0 of 1 free Pro articles.
Since I have been relatively optimistic about an oversold rally this week, I want to spend today talking about the Nasdaq and technology in general.
Back in September and October, I spent a great deal of time talking about the excesses in the market. We talked about the quantum stocks, the rocket stocks, the meme stocks, the penny stocks, and the AI bubble. Much of this falls under the category of non-profitable tech.
Yesterday, we looked at what I now consider a decent guide to small-cap unprofitable companies vs. profitable companies by looking at the ratio of the Russell 2000 to the S&P Small Cap 600. It appears to have peaked a few weeks ago and is now making marginal lower lows.
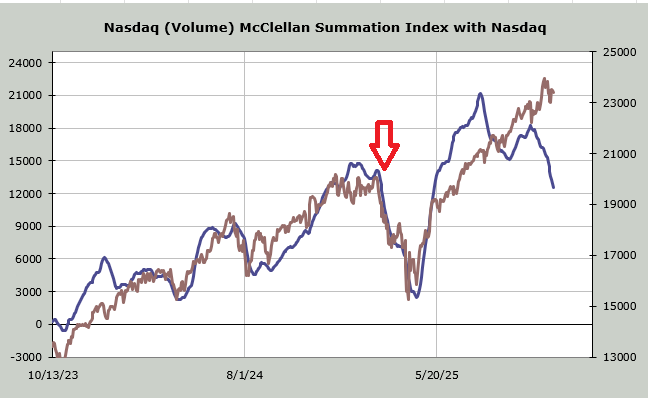
Now, I would like you to look at the Nasdaq McClellan summation using volume. From the April low until last summer, it had been relentlessly upward. The minor correction we saw in May didn’t even register on the chart (blue line). But last summer, after the August peak, we saw this indicator have its first corrective move.
As the market ramped up again in September, the indicator headed back up. This time, the oomph was not nearly as emphatic, and the indicator made a lower high. Since that low in early to mid-October in Nasdaq, this indicator has not only headed south, it has accelerated to the downside. You do not need to squint to see the divergence now.
I have highlighted (red arrow) the last time we saw such a divergence, but to be fair, once the indicator headed down in a big way, as it has now, the Nasdaq did not take long to follow. This time, the Nasdaq has held up, and the divergence is obvious.
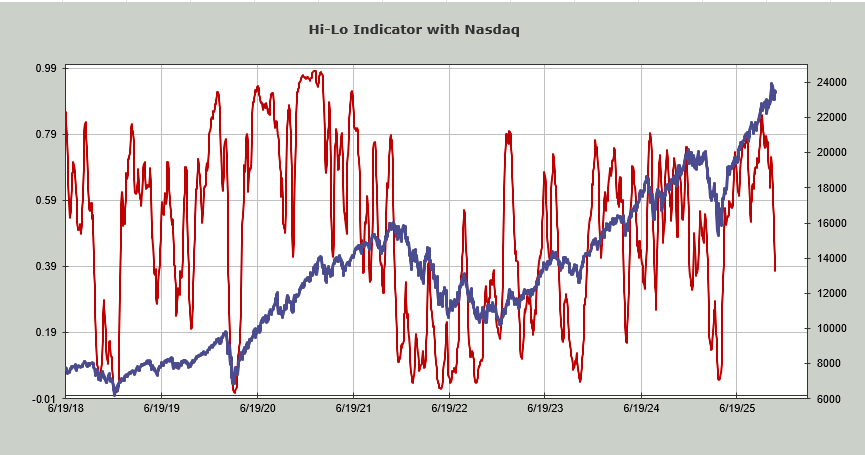
The Hi-Lo Indicator is at .38 now. This is the lowest it has been since April, when it was coming off the lows. This indicator is not great at tops (very few are), but I have noted that the new lows on Nasdaq have been expanding (although they did not expand on Wednesday), and the new highs have refused to expand. The result is seen in this chart: how truly poor many tech stocks have acted over the last month.
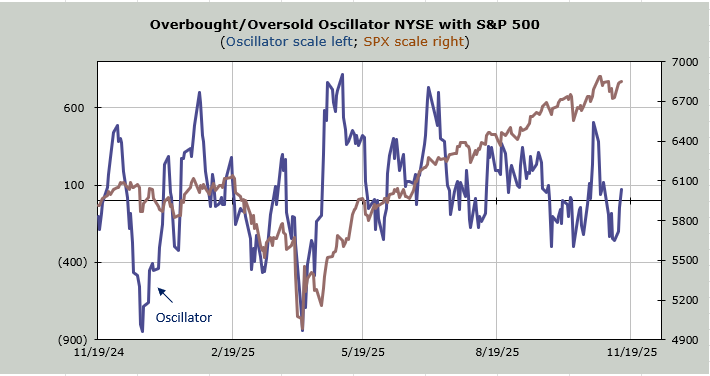
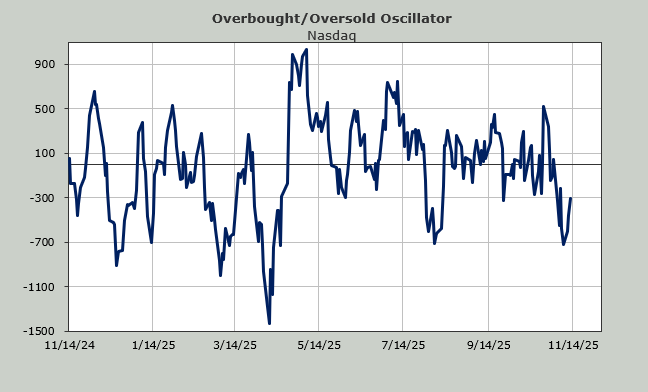
Even if we look at the Overbought/Oversold Oscillator for Nasdaq, we can see that, sure it has lifted off the oversold condition this week, but it is still well below the zero line.
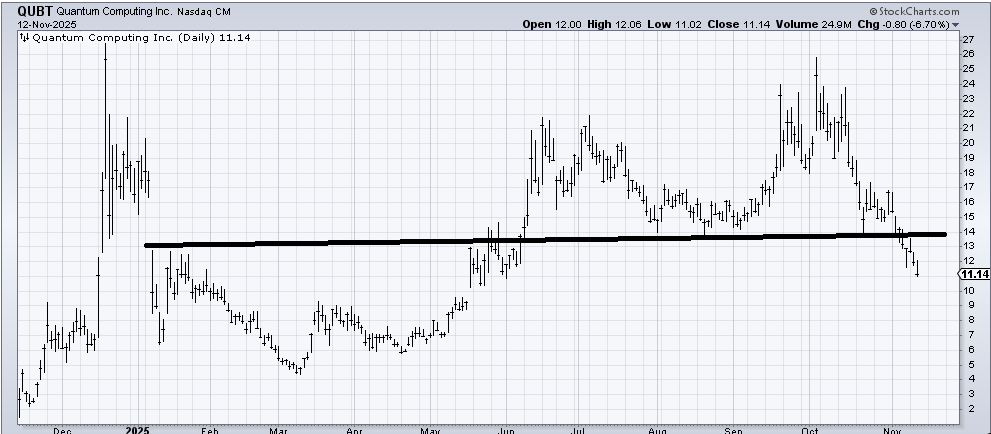
The quantum stocks were so hot, but now look at a name like Quantum Computing (QUBT) and see that it has more than halved since early October. And it has done so with hardly a respite save the final week of October.
Is this shift away from these ‘new technology’ stocks long-lasting? Oh, I’m sure there will be some other hot non-profitable group that pops up, but from what I see, it seems to me the market has moved on from them, much the same way it moved on from SPACs in early 2021.