You Can't Always Get What You Want
Most of the indicators are just not budging, but there are few notable changes. Let's look at the equity put/call ratio, which is harkening back to two other time frames, the Utes and more.
You've reached your free article limit
You've read 0 of 1 free Pro articles.
I know you want me to tell you the indicators changed. But I can’t. Most of the indicators are where they were three days ago: They haven’t gone up much more and they haven’t rolled over.
I promise I will continue to monitor them for changes, but there are only a few highlights.
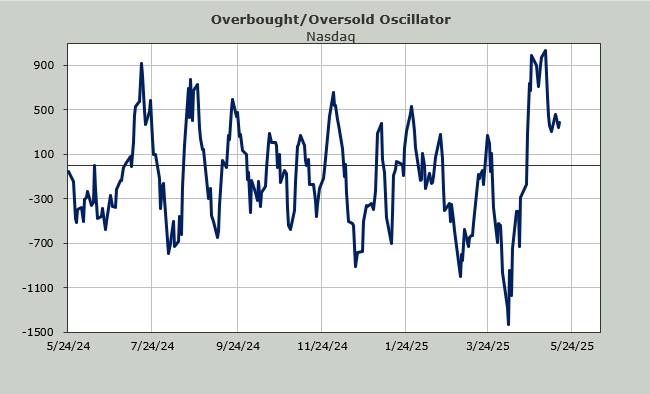
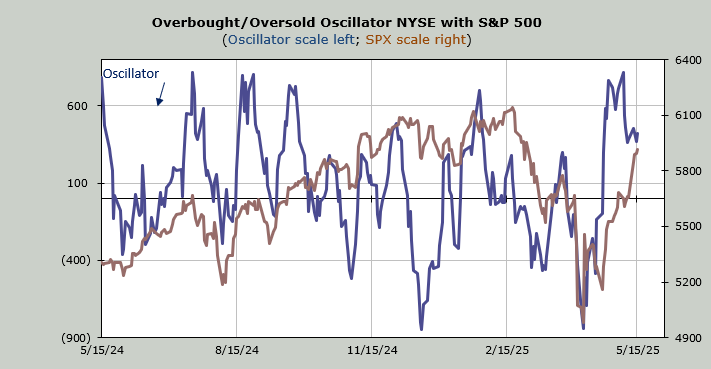
The Overbought/Oversold Oscillator hasn’t budged all week. So that’s a minor short-term negative divergence with the S&P 500 notching a higher high and the Oscillator at a lower high.
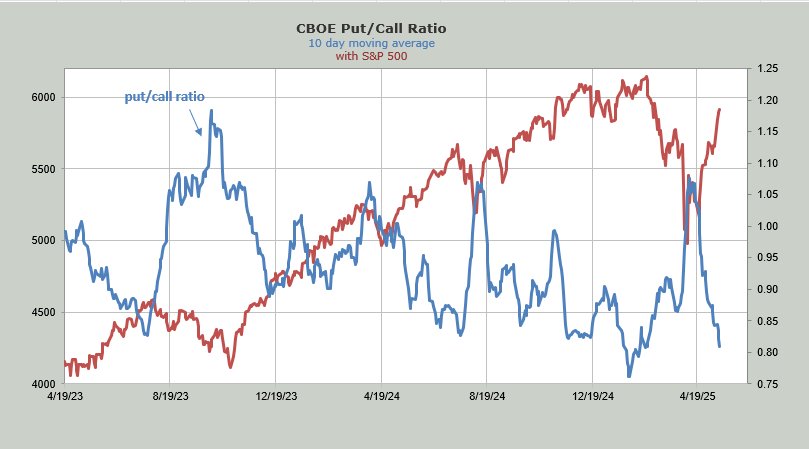
The other change is that the equity put/call ratio on Wednesday fell to 0.41. This is the lowest reading since mid-January. Prior to that we have to go back to mid-July 2023. Here is a chart of the S&P showing those two time frames.
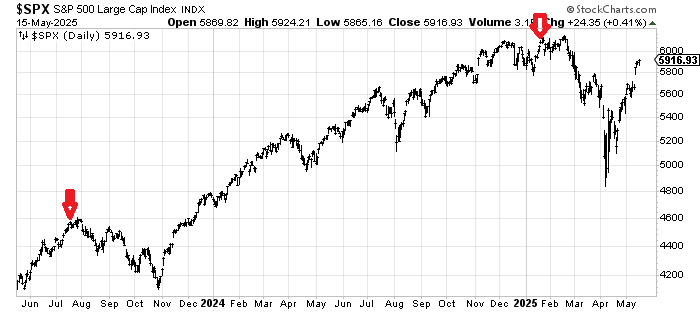
If you squint you can see the 2023 reading had one more push upward into late July before rolling over. January is probably a bit fresher in your mind but we pulled back and rallied again before heading south. In both cases the declines lasted months.
Before the bears get excited, let me report that in both those cases the breadth indicators were already rolling over, something they are not doing now. What is noteworthy to me is that the market rallied for more than a year — from the fall 2023 low to January 2025 and not once did we get such a low reading and when we finally did, it meant something.
In 2023 we had been rallying for about nine months when the reading finally arrived. This time it took a few weeks.
Meanwhile, the 10-day moving average of the total put/call ratio was 0.70 once again on Thursday (as it was on Wednesday). That means the 10-day moving average is now knocking on the door of 0.80. It doesn’t get down there very often. However, it has yet to turn back up. I figure one day of a reading in the 90s and it will turn up.
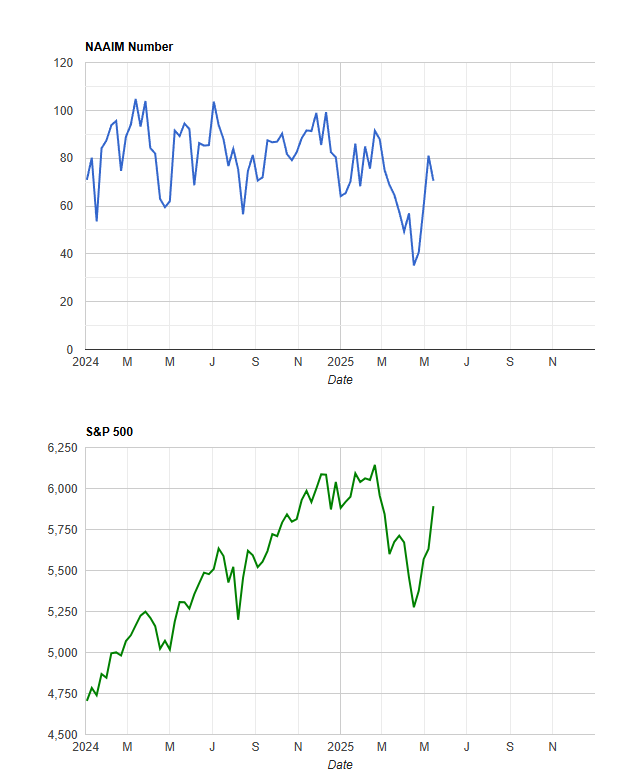
Sticking with sentiment, the NAAIM folks actually decreased their exposure to the market, which shocked me. They pushed down from 81 to 70. So no increase in bullishness there.
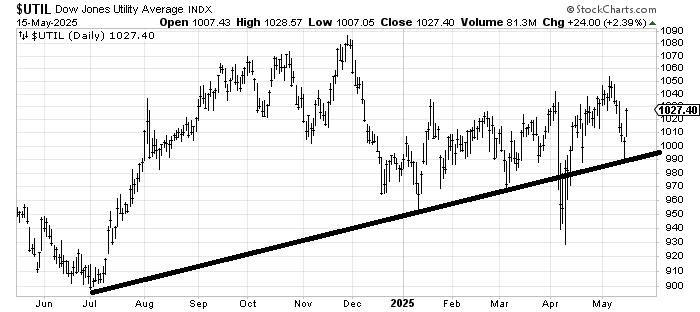
You know what else changed? The Utes. That was a slingshot move off that 990 support. I thought they’d bounce but not that much.
Aside from those changes, the McClellan Summation Index is still rising. The Hi-Lo Indicator for the NYSE is still creeping upward. The Nasdaq’s Hi-Lo Indicator is still upticking but has barely budged since doing so.
The DSI for Nasdaq is still 79. The S&P's is at 77 and the VIX is at 19. They too haven’t budged in days.
I promise I will report when the indicators shift but thus far the shifts have been few and far between.