Yeah, We're Oversold. But What Comes Next?
Let's look at the indicators. Some are positive, but not all.
You've reached your free article limit
You've read 0 of 1 free Pro articles.
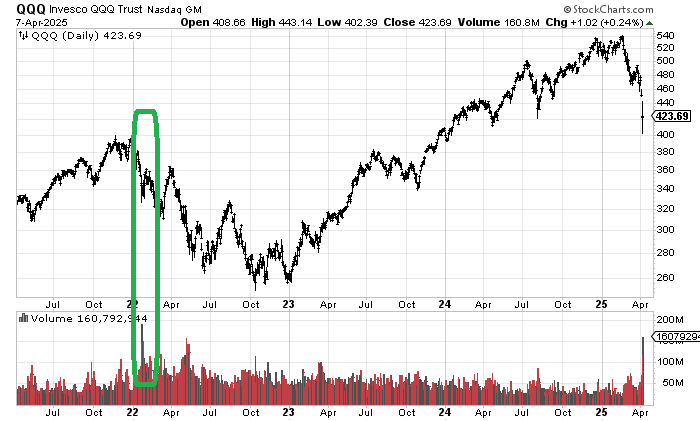
Remember when I asked that we get some high volume in the QQQs? I was begging for 75 million shares to be traded on the day. Friday, the QQQs saw 115 million shares traded, which I thought was a lot, considering we hadn’t seen that kind of volume in nearly three years.
Monday played ‘can you top this’ when the volume in the QQQs topped 160 million shares! That is not quite a record, but it’s up there. The record was in mid-January 2022 when the QQQs traded 199 million shares on a day that was an options expiration, and Netflix earnings disappointed, so folks sold QQQs big time back then.
Notice that the market rallied off that massive volume. The QQQs rallied nearly ten percent. And yes, they did come down again. But that’s what I’m talking about: getting a rally off this sort of volume. And coming back down. That pattern is typical.
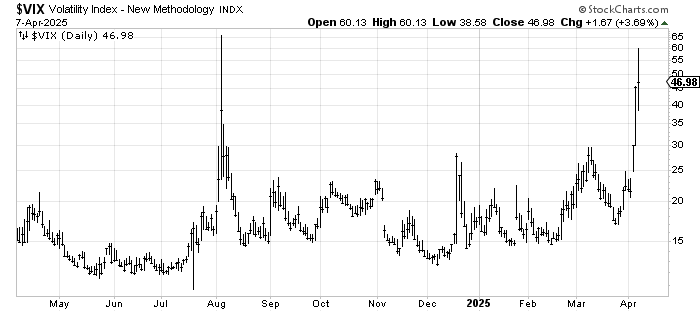
The VIX maintained its jumpiness, closing up on the day. But at this point, I would expect it to back off.
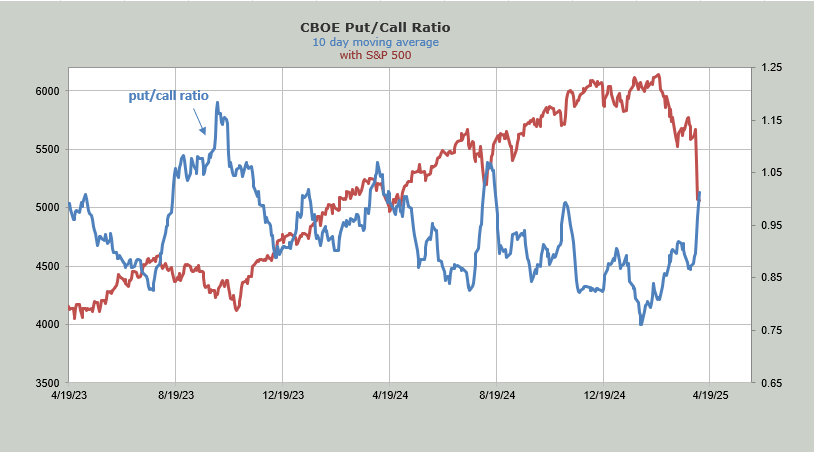
The put/call ratio was high at 1.23. That makes it now three straight days with high readings, something else I’ve been asking of the market. This has pushed the ten-day moving average of the put/call ratio up just over 1.0 for the first time since just prior to the election. It is now closing in on where it was in August.
On a relative basis, considering the decline we’ve seen in the market, it continues to look tame compared to other instances, but for now, it goes on the short-term positive side of the ledger.
What doesn’t go on the positive side of the ledger is the ISE call/put ratio. Keep in mind this is mostly small options traders. Typically, by this point in a decline, that ratio would be clocking in readings well under 1.0 on a regular basis. Thus far we only have two such readings and the reading on Monday was 1.25, so it wasn’t even hovering just over 1.0, it was solidly there.
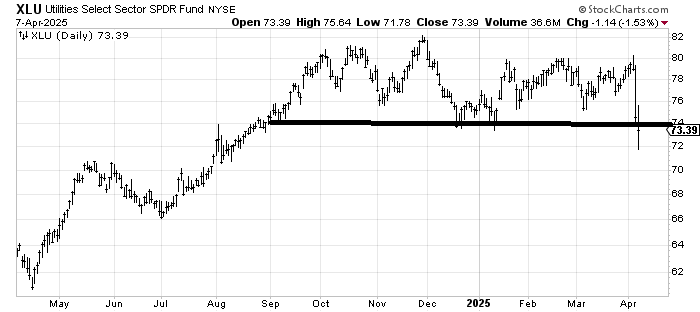
One other chart I think is worth highlighting is the Utes. They broke down on Monday. Sure, XLU can recapture 74 quickly since it closed just under it, but bonds gave up their rally, and so did the high-yield and junk bonds. I would use these charts as another reason I think after this rally, we see the market head back down again.
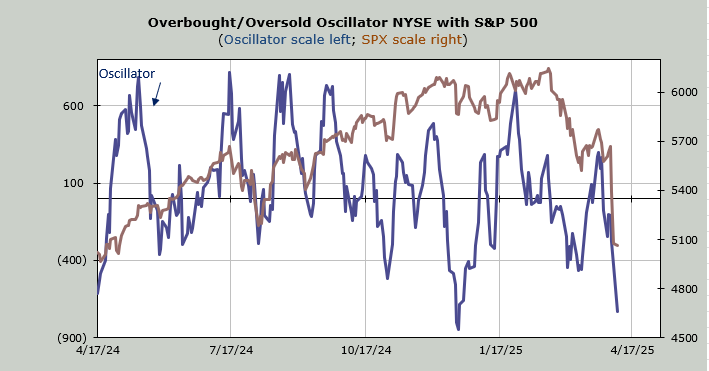
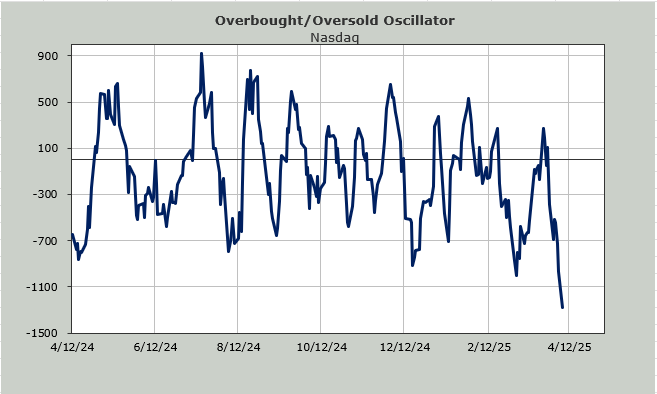
I should end by noting how oversold Nasdaq is. We looked at the Nasdaq Momentum Indicator yesterday, but today, we should look at the Overbought/Oversold Oscillator. That is quite a move down and another reason I think we should enjoy an oversold rally.
But look closely and notice that it made a lower low and lower lows generally need to be retested. That’s why it’s a trading market and not one to fall in love with.