With a Strong Result for Oracle, We Could Be on the Verge of Giddiness
Important inflation numbers are out this week, but the market's reaction to Oracle could be what moves the indicators.
You've reached your free article limit
You've read 0 of 1 free Pro articles.
Will Oracle break the stalemate of the indicators? Will we finally get them to move in one way or another? This is a big test for the market.
If Oracle rallies and drags the indexes with it, but does so while leaving the others in the dust, then the indicators will change because we’ll probably have all these negative divergences popping up. For example, on Tuesday, breadth was down while the indexes were up.
It wasn’t enough to fuss over because it didn’t move the indicators. That is the key: will the mega caps rally and leave everything else behind? Or will the group rotation stay alive? By group rotation, I mean, does mega cap tech get a day, and then we go back to rotating through the others? Or does it leave it behind?
Leaving the others behind will change the indicators. Dragging them up with the Mega caps might also change the indicators. But at least we have something on the table that could finally move the needle.
Oh, I know there is an economic number out on Wednesday (Producer Prices), which could move the market as well. Anecdotally, some food prices feel higher to me, but then I needed to replenish my supply of chart paper this week, so I went to get some, figuring for sure it would be pricey relative to last year.
I should stop and explain that the chart paper I use hasn’t been made since 1989, so it’s not like you go to a store, or even to a website, and buy it off the shelf. Rather, I take an original piece of chart paper (it is logarithmic and divided by the days of the week; it is meant for stocks) and go to the copy store. They must go through several tries each time to get the color (blue) correct, as well as the thickness of the paper (it really changes from year to year!).
In any event, I am happy to report that the cost of my chart paper did not change year over year. I doubt the government uses chart paper in its calculations for inflation, but since it is basically just paper, I consider that a good thing that the price has remained steady!
Back to the indicators, though. There was a minor change in the Daily Sentiment Index (DSI) that I feel the need to highlight. Nasdaq is now at 78. That is still neutral, but if Oracle drags Nasdaq much higher, that is likely to push into the 80s (as will the S&P). A reading over 85 is a yellow flag, especially now that the DSI for the VIX is back at 20.
So, it’s a double-edged sword: more rallying might lift the indicators, but it also probably changes sentiment from complacent (where we have been for two months now) to giddy.
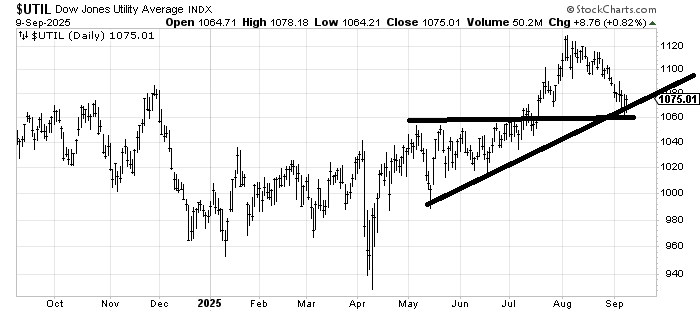
But hey, at least the Utes finally rallied off support, after seven straight red days!