Will the Market Sing 'Friday I'm in Love' or 'Heartbreaker'?
Let's discuss the good and the not good news on the charts, Friday's pattern and the indicators. No matter what, though, I would love to see what’s 'up there.'
You've reached your free article limit
You've read 0 of 1 free Pro articles.
Love is in the air, can you feel it?
After that oh-so-bearish reading for the AAII on Thursday morning, folks found a way to buy the market. Right back to the same spot we have been to several times before.
But did they really love it? Or are they convinced that it will fail up here as it has? And what’s more, do they now realize that the last three Fridays have been red and they are betting on four?
I ask this because the put/call ratio was 0.94 on Thursday. This is the highest reading since January 13 (the low) and considering how much folks are loading up on calls these days, I find it curious that there were puts being bought on an up day.
Is this a case of pattern recognition? Where the market shows us a pattern over and over again (Fridays are down and we have failed at the highs) and the market participants have learned the pattern? Or is simply a case that the same as the rise in bearishness from the AAII survey, something happened this week to spook them?
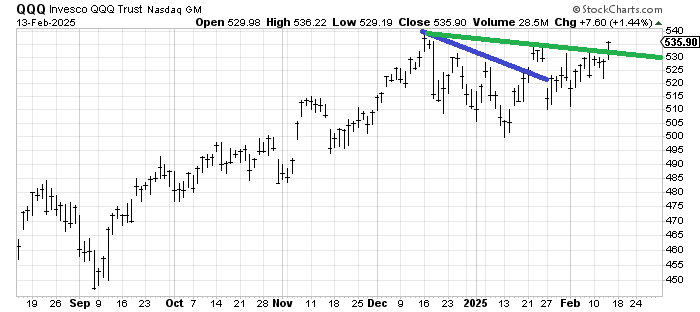
I don’t have the answer. But I would say if you are drawing in the green line on the QQQs and believing this is a breakout then how is this time different than the blue line drawn in late January?
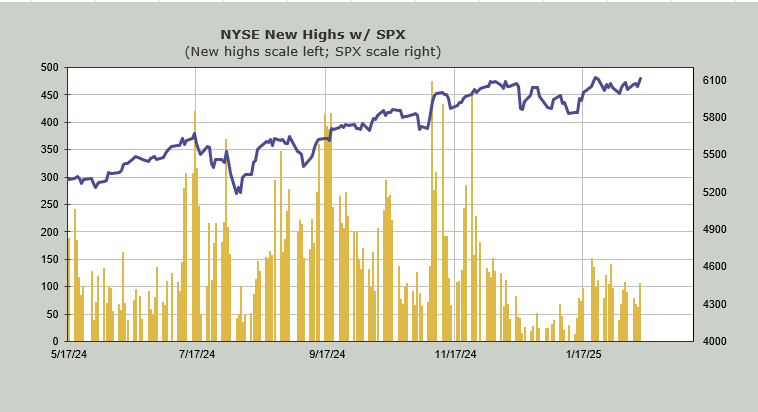
That means we should cast an eye on stocks making new highs. The Nasdaq saw an increase (same as the increase in late January) but we notched a few more new highs than late January. That’s good news.
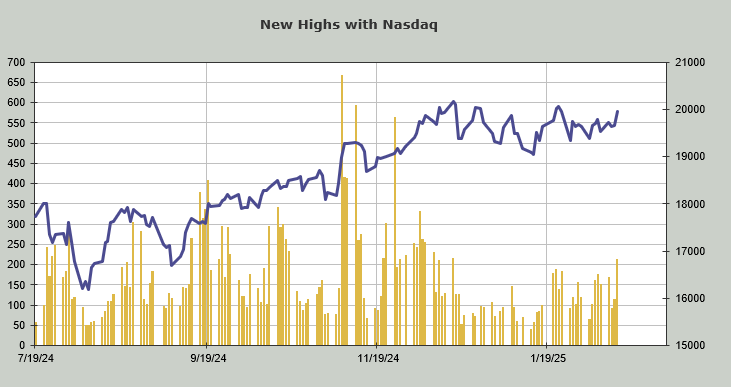
The NYSE couldn’t manage an increase in new highs, though. That’s not good news.
And I should note that should the indexes make higher highs they are both likely to fall far short of the number of stocks making new highs in November and December. But that’s for me to complain about on a different day!
I would love to see them change the pattern of down Fridays as well as break out to new highs because I am sick of the chop. But also because I would love to see what’s up there. The same way I want to see us break an important level on the downside to see what’s down there, I like to see the upside as well.
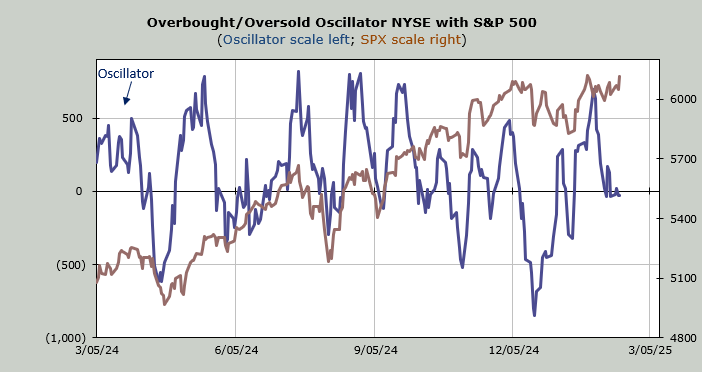
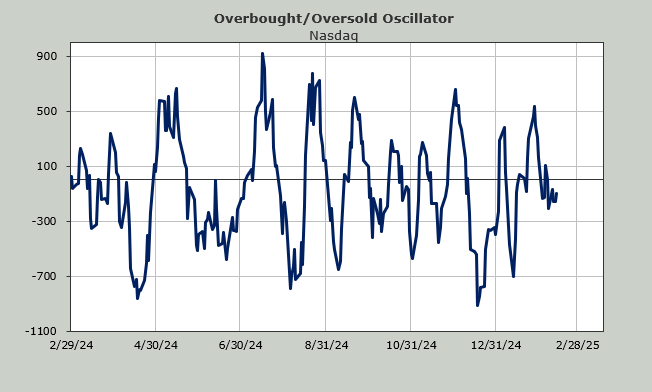
Aside from that none of the indicators changed. When you look at the Overbought/Oversold Oscillator and see it is still sitting on the zero line I will tell you that is correct.
You see, the net breadth 10 days ago (from Thursday) was +1,576 and net breadth on Thursday (yesterday) was +1,574. That nets out to no movement. That’s why this momentum Indicator shows no oomph from Thursday’s rally. For the next two trading days we drop two negative readings so let’s see if we can get that Oscillator up, back to an overbought reading.
Maybe Valentine’s Day will bring some market love.