Why Are the Transports So Strong? Because of the Semis. The Semiconductors, That Is.
Has hedging activity led to unexpected relationships among sectors?
You've reached your free article limit
You've read 0 of 1 free Pro articles.
 Tesla Truck Won't Move the Stock's Needle
You know what capitulation bottoms give us? V bottoms.
You know what no capitulation bottoms give us? Rounded bottoms.
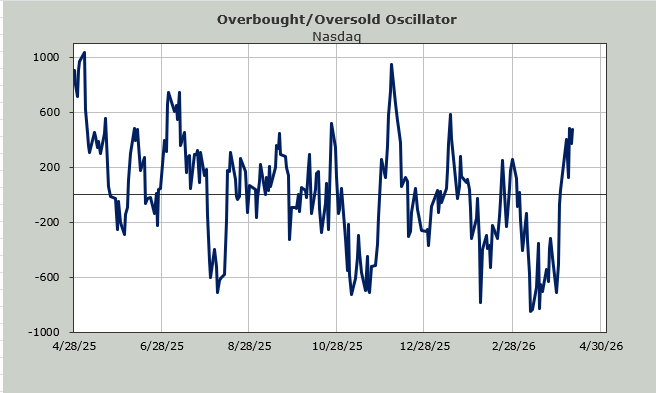
So, for all of you saying there was a V bottom, I ask you, did you see capitulation? Because I did not. In fact, about the only chart I see that had a V bottom was Nasdaq. That’s a V. That’s also where all the selling was.
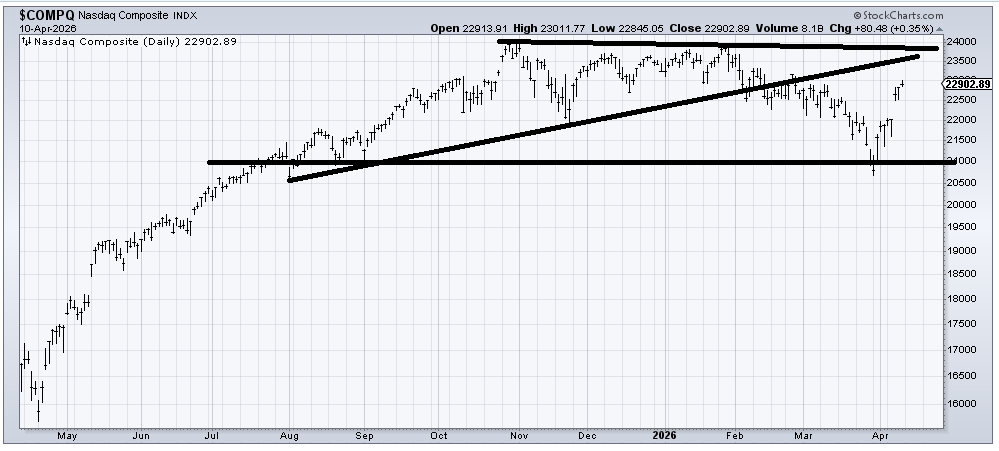
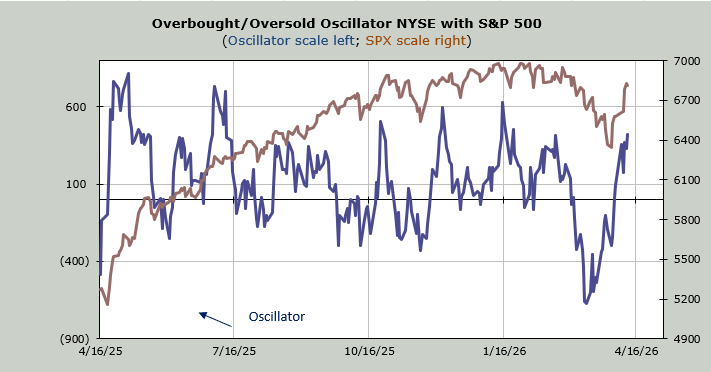
We know Nasdaq had all the selling because we saw the Hi-Lo Indicator for Nasdaq get oversold, whereas the NYSE’s Hi-Lo Indicator did not. We know Nasdaq had all the selling because we saw the number of stocks making new lows peak in early February, with fewer stocks making new lows on each push lower.
But does (IWM) look like a V bottom? Not to me it doesn’t. IWM got to just under 245 in early March, then it spent the next few weeks trading between 245 and 250. It had one day where it plunged to 240 and came right back. Then it had another day where it did that and came right back. Maybe it’s my old eyes, but I see more of a rounded low than I see a V.
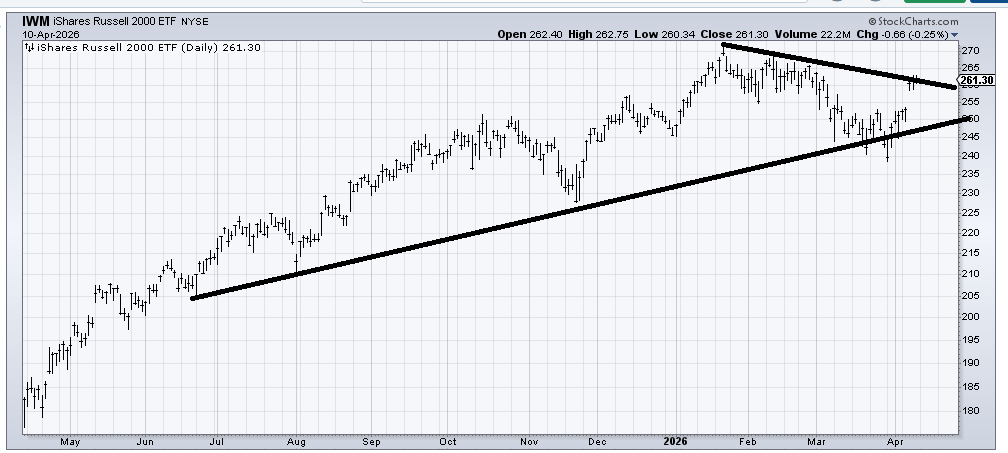
Here’s what else I see on that chart of IWM: a rally into resistance. I also see a chart that gapped up Wednesday and sat there, spinning its wheels.
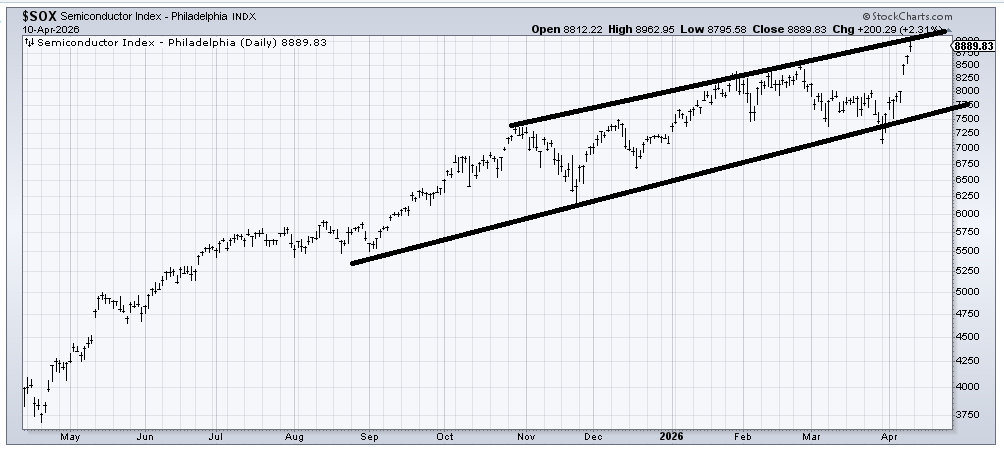
Then I look at the chart of the SOX, and I also see more of a rounded bottom than I do a V. The SOX plunged to just under 7500 in early March and then spent the ensuing two and a half weeks trading between 7500 and 8000. It had that last plunge down and then came right back into the range it had been in most of March. Again, that does not look like a V to me.
Then I see the move the last three days, which was definitely not a gap, and I sit and think that I have so few charts that did not gap and sit. The Transports do not look like the SOX, but the Transports also had a rounded bottom, not a V. Again, most of March was spent milling around at the lows.
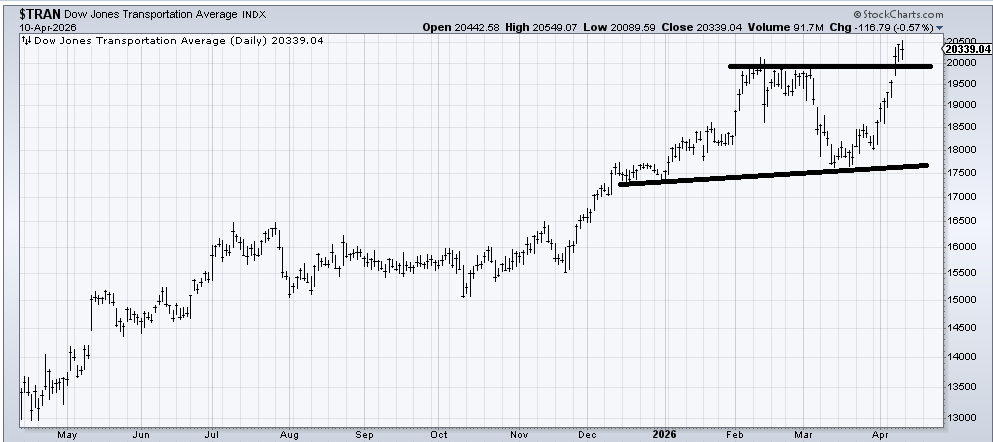
So when I am asked for a narrative (I am terrible at narratives) for why the Transports have been so terrific, the only thing that comes to mind is the SOX.
We know how much hedging was going on. We see it in the ETF put/call ratio chart that I have shared with you almost daily. You do not get the 21-day moving average soaring like that if folks are not loading up on ETF puts. Say you’re worried about oil and helium, and you think I will buy puts in the SOX (SMH) and the Transports (IYT) since clearly they are most vulnerable. So when the unwind from the hedges shows up, that’s where we see it. How’s that for me making something up?!
In the meantime, we are getting short-term overbought early this week. Let’s see if we get some sort of pullback from that overbought condition. A gentle pullback would be vastly different than a gap down from the last three days of sitting there. A gap down that doesn’t recover quickly would leave the last three days as an island.
Related: Sticking With Palantir Plan After Big Short's Michael Burry Sends Warning
