What Does the U.S. Debt Downgrade Mean for Stocks? Let's Take a Trip Back to 2011.
A look at the charts of the 10-year yield, McClellan Summation Index and S&P 500 reveal where we were at 14 years ago and today, while the indicators get their first test this week.
You've reached your free article limit
You've read 0 of 1 free Pro articles.
I suppose we should start with the downgrade of U.S. debt. This is not an area I should opine on per se but I think we can look at the charts to see if there are any similarities to past instances.
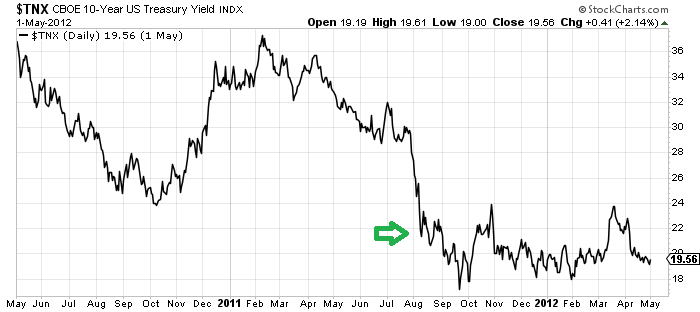
Let’s start with a chart of the yield on the 10-Year from 2011. The green arrow shows where the yield was when we saw the downgrade in early August 2011. Let’s call it 2.2%. Not only that, yields had been heading south since February.
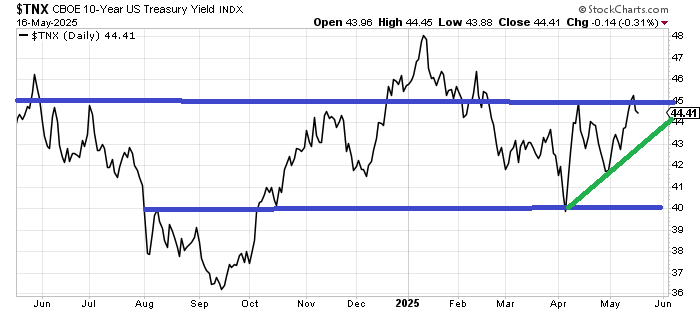
Now let’s look at bond yields today. They are hovering near 4.4%. But unlike 2011 where there was a discernable direction in yields (down), there is no discernable direction now. The last two and a half years have seen yields between 4 and 4.5% with a few forays out of the range that didn’t/couldn’t stick.
So let’s say bonds are not in the same place.
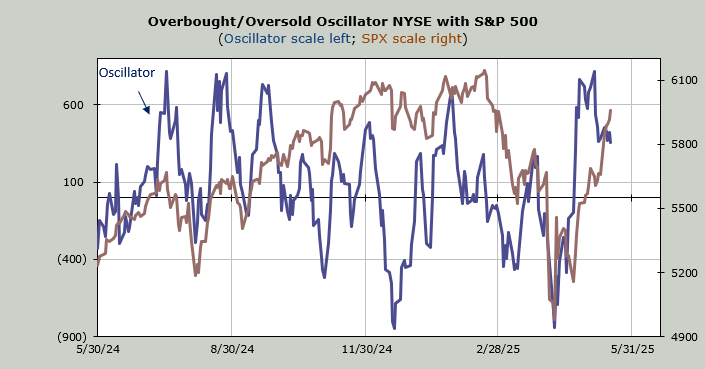
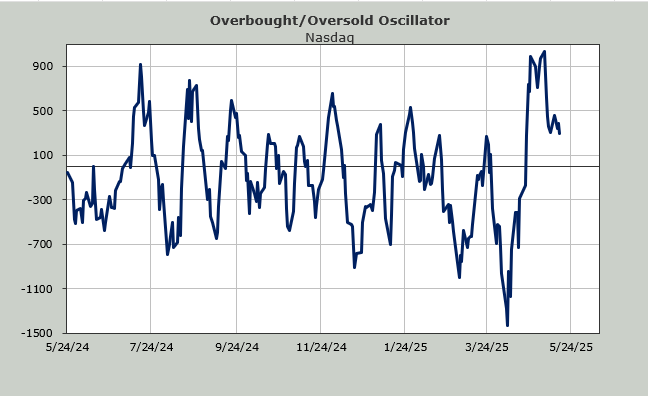
Let’s forget the stock indexes on their own for now but rather let’s take a look at the McClellan Summation Index from that time frame. This is a great breadth indicator because it smooths it out. It actually peaked in the spring of 2010 but for argument’s sake it made a high in the fall of 2010 and every single rally thereafter was a lower high. By the time the downgrade rolled around this breadth indicator had plunged already. After that it actually started the process of making higher lows (bottoming)
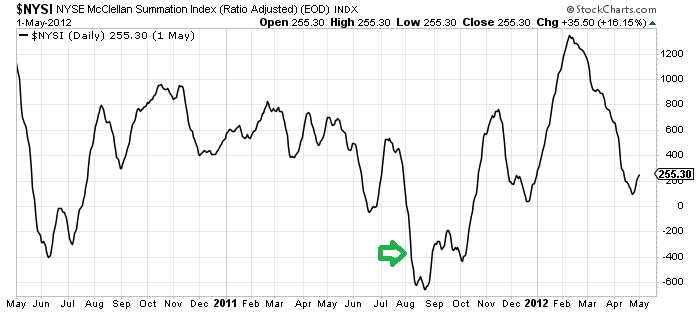
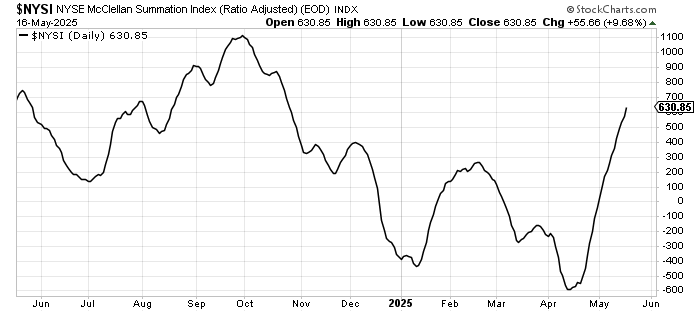
Today’s Summation Index has been rising since April, without a breather. It has not made a higher high than September but it is higher than February. To me that means that breadth is not in the same place either.
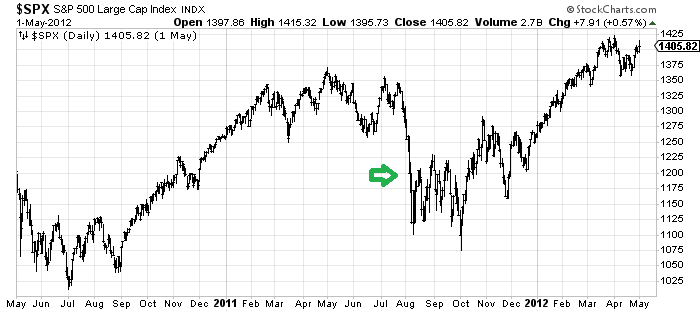
And what of the S&P 500? It had been going sideways all year in 2011. We were already down a lot by the time the downgrade arrived. As we know, the market has been rallying for five or six weeks now so again, the situation is different.
Back then the downgrade began a bottoming process. I think we can all agree with the S&P knocking on the door of resistance, it’s simply not comparable.
That’s a long way of saying I don’t know how the downgrade affects stocks, but I don’t think we can do an apples-to-apples comparison because from an indicator standpoint, the situation is different.
I still anticipate an intermediate-term overbought condition to show up at the end of this week. If we get some of the indicators I have been highlighting to roll over by then I would not be surprised at a market that gets volatile in June. As of Friday none of the indicators had changed, though. This will be the first test to see if they change.