Where Did All the Bears Go?
Not many bears out there right now. Let's see how the market performed after investors were similarly bullish.
You've reached your free article limit
You've read 0 of 1 free Pro articles.
The best news I can offer is that, at least after such terrible action under the hood, most now see the poor breadth.
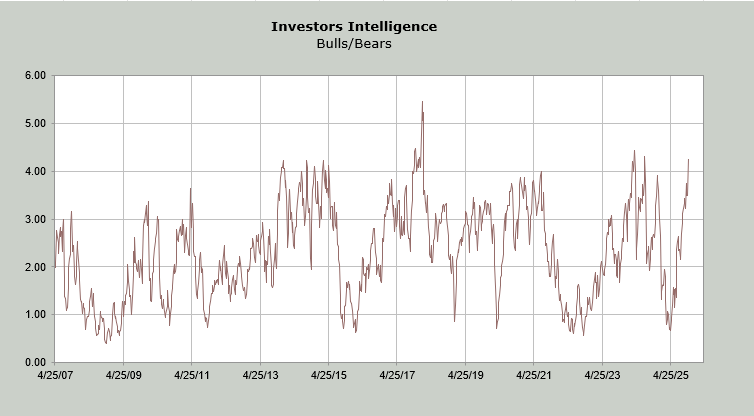
But first, we must contend with the actual data, not the anecdotal evidence. And the Investors' Intelligence bulls rose back up to 57% this week, but it was the bears that caught my eye. At 13.5% they are now the lowest since January 2018. The good news is that we saw the S&P crank higher for another week or two. The bad news is it gave it all back and more in a matter of days.
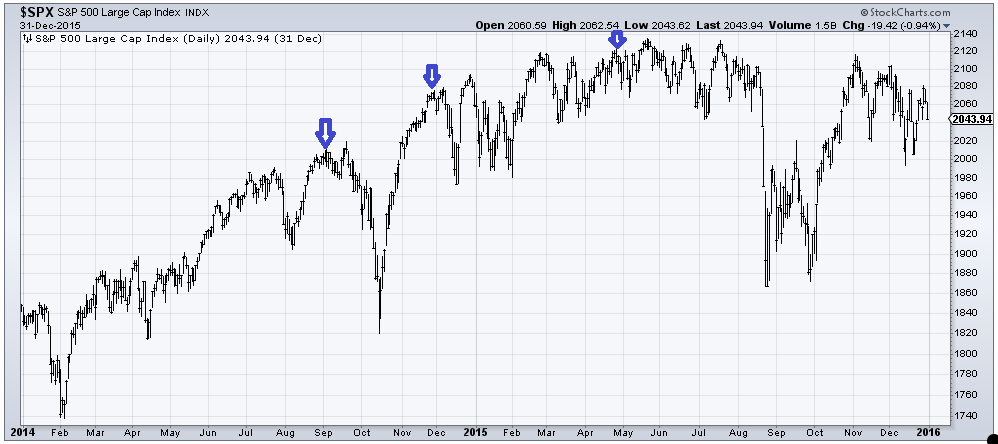
We also saw such low readings back in 2014 (which I will pause and say I think is odd because it was 2013 that was such a good year). We saw readings under 14% for the bears three times in that 2014–2015 time frame. All are noted on the chart of the S&P. The first two times we dipped, rallied, and then whooshed. The third time we meandered downward, but mostly we just went nowhere for nearly four months, and then we went whoosh.
The bulls might not be over 60% yet (they were a bit higher a month ago than they are now), but the ratio of bulls to bears is now at 4.2. You might recall I have been talking about getting a reading over 4 (this means there are four bulls for every bear) as a sign we finally got some giddiness. Well, we got it.
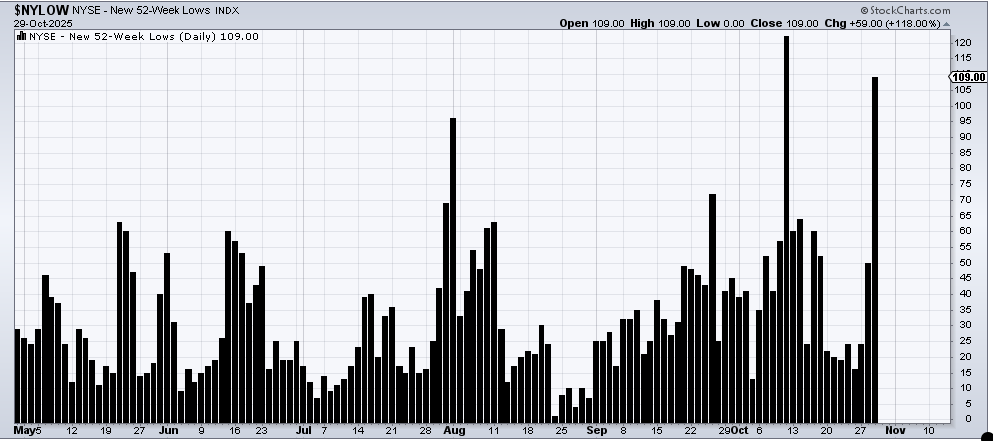
Now let’s get back to breadth. As we know, it’s been pretty pathetic this week. During Wednesday’s session, the number of stocks making new lows on the NYSE more than doubled. They now number 108, which is the highest they have been since mid-October when they hit 122. Of course, the S&P was 400 points lower then than it is now. That pretty much tells you what’s happening under the surface.
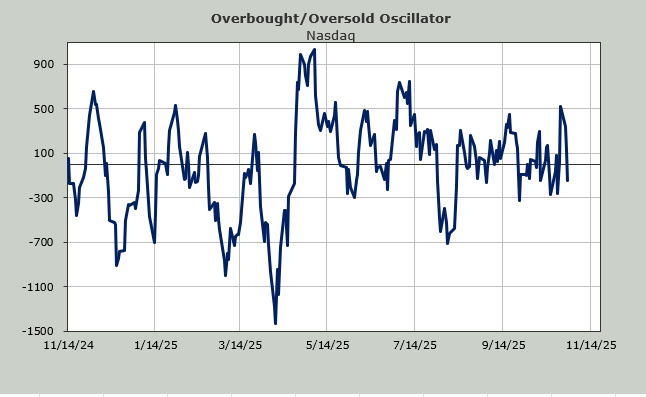
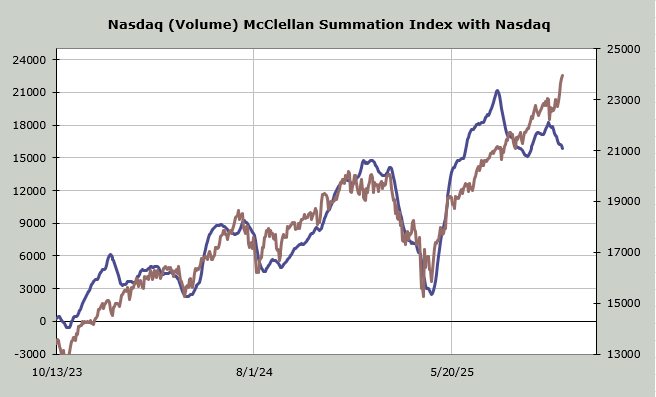
Nasdaq’s new lows are similar, but Nasdaq has something else going on. For the longest time, the McClellan Summation Index using volume was on a nonstop push upward. That changed last summer, but it reversed and headed higher in September (all that speculative action helped). But now look closely and notice that since the mega caps started rallying again, the Summation Index has turned down. It has not been able to have an uptick during Nasdaq’s run from 22000 to 24000 (a ten percent rally). Again, this is a sign of what is going on under the indexes.
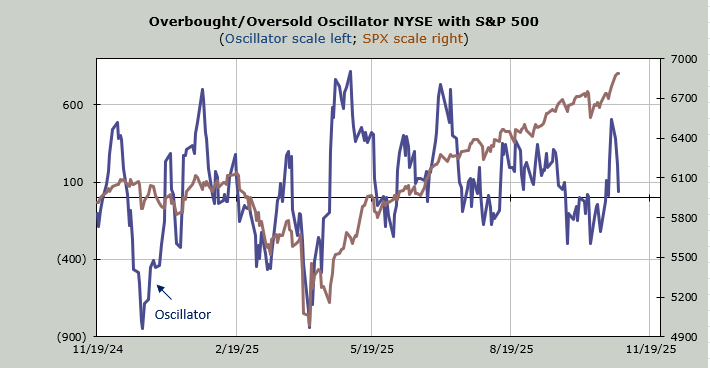
As for the Overbought/Oversold Oscillator, that has come down quite a lot as the week has worn on. That’s what happens when breadth is so poor. I don’t yet have a timeframe for when it will get back to an oversold condition. But hey, it’s possible we wake up Thursday morning to news that there is yet another press release telling us how great the Chinese trade talks are going!