Where Are All the Seasonality Bears?
There was one thing that I thought was pretty bearish during Tuesday’s session.
You've reached your free article limit
You've read 0 of 1 free Pro articles.
I was convinced that if we saw some downside in the market in early September all the seasonality bears would come out of the closet (wait, I think bears come out of caves, not closets...) and we’d hear all these stories of how bearish September is which would help push sentiment to the negative side of the ledger.
I guess two down days (Friday and Monday) and giving up all of the Fed Chair Powell gains did not deter anyone. Now we see 2026 S&P 500 targets in the 7700 area. We see the folks who have been all bulled up on tech shrugging, saying it’s all good. So if I had one thing that I thought was pretty bearish during Tuesday’s session I would say it was the complacency.
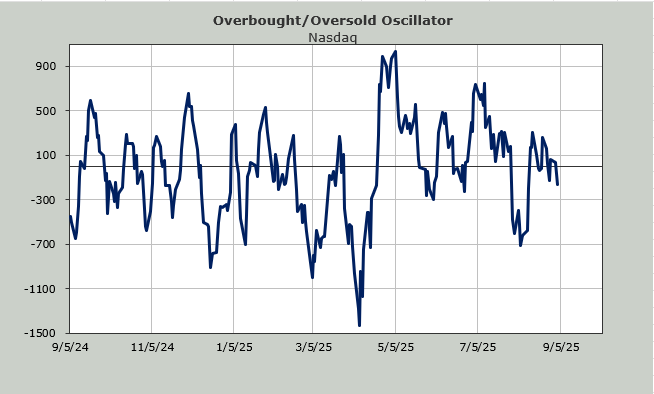
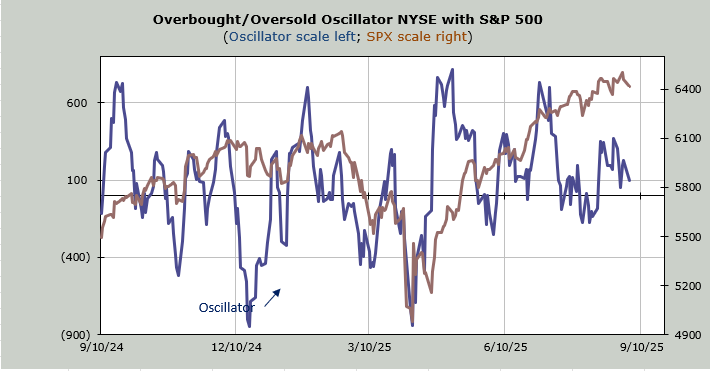
Because as far as the indicators go, they barely budged.
The new highs are still pathetic. The new lows increased a bit but nothing dramatic. Breadth was pretty much in line with the decline. The S&P fell 100 points and downside volume never even got anywhere near 90% on the NYSE. It was in the mid-70s at its worst.
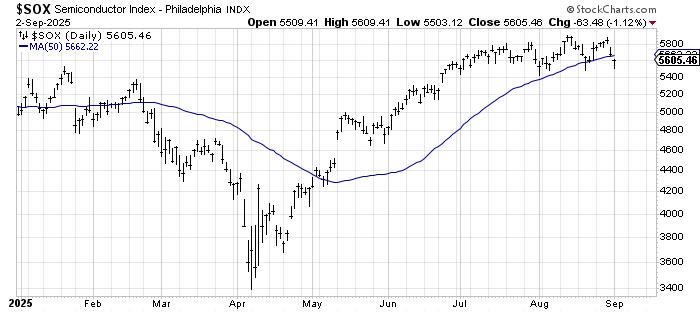
Prior to my vacation we looked at the 50-day moving average lines for the SOX and Nasdaq. I noted that they had not yet broken even though we were now touching them more frequently than we had been in the spring.
Notice how the QQQs bounced right off their 50 DMA, the same way they did in mid-August. In late July they didn’t quite get there. Keep in mind that 50 trading days ago was that final week of June, which means that’s the price the moving average line is dropping now. As long as we drop lower numbers and add higher ones the moving average is rising. A rising moving average is more supportive than a rolling over one.
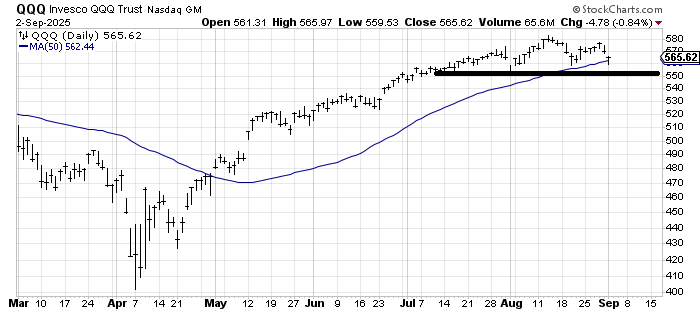
While we are looking at the QQQs let me address the question that has littered my inbox: Is that a head and shoulders top? As someone who sees a head-and-shoulders pattern everywhere I would love to say without a doubt, yes it is!
But notice the right shoulder is higher than the left and if you are drawing the neckline starting from that whoosh in late July, then the neckline is up slanting. The same rules I apply to the 50 DMA I apply to necklines: upslanting ones might be easier to break but they are less meaningful than flat ones.
I look at the chart of the QQQ and I see $550 has been good support since July. If we visit that and — a big "and" — the moving average line is rolling over or flat, I’ll fuss over the head-and-shoulders pattern. Otherwise it’s just an elongated sideways pattern for now.
But now look at the SOX, which is below its 50 DMA. Here, though, it is dropping numbers pretty similar to where it is trading now. If the SOX cannot recapture that 50 DMA then as we get into the second or third week of September that moving average line will start to roll over. That and support at 5400 remain important to this leading group.
Finally, I must report that the metals did have an awesome day on Tuesday. But alas all that awesomeness came with the Daily Sentiment Index (DSI) for gold tagging 88 and silver at 87. There might be some more juice left in them but the runway is now short. Sentiment got downright giddy in just one day.