When It Seems Like the Market Will Never Go Down Again, Is a Shakeout Coming?
There are new highs for stocks this week, but really, the market is flat.
You've reached your free article limit
You've read 0 of 1 free Pro articles.
We’re at that stage in the market where my inbox is filled with either a comment such as: the market is never going down again, or a question: is the market ever going down again? At this point, it seems like the answer is no.
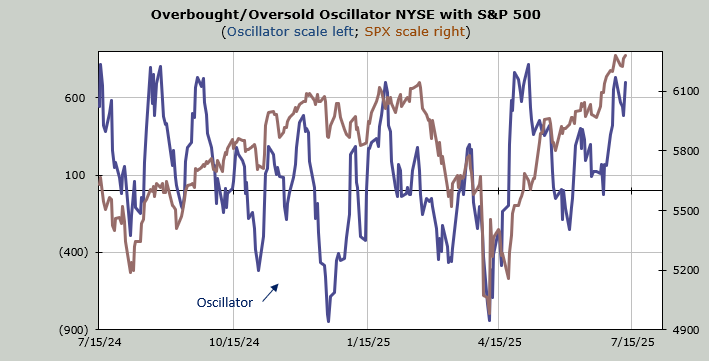
Thus far, the overbought reading and the giddy sentiment have produced an S&P that is flat on the week. That’s it. Yes, I know it feels as though it is up, but it is not.
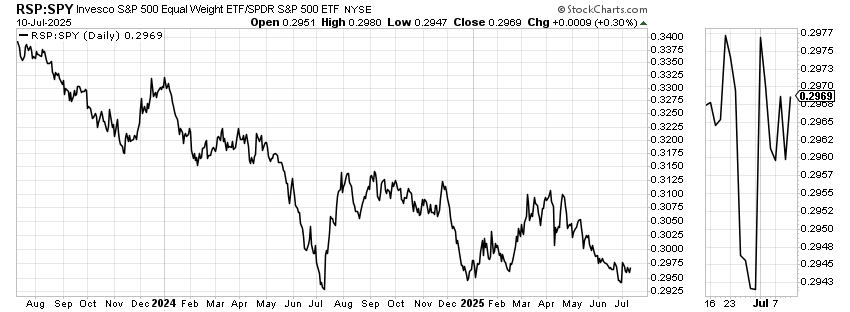
Then there is the equal weight S&P relative to the S&P. We looked at this a few weeks ago, and it has bounced (see the blown-up portion of the chart on the right) from this level. But notice something else: it still hasn’t gotten over those twin highs at .2977.
So, yes, the equal weight is doing better, but look how it zoomed upward in July last year. This is much more meandering, isn’t it?
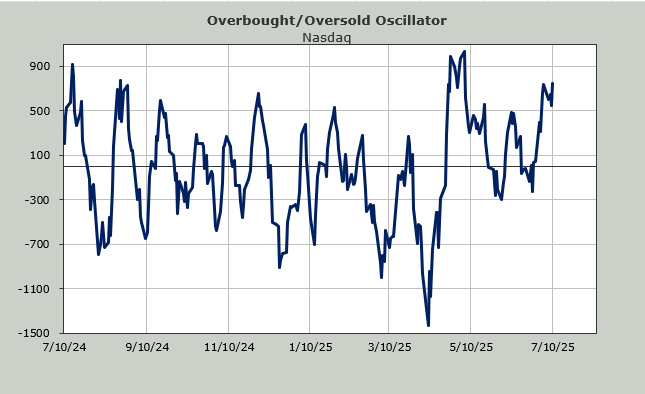
That’s probably why the number of stocks making new highs continues to lag. But breadth does not.
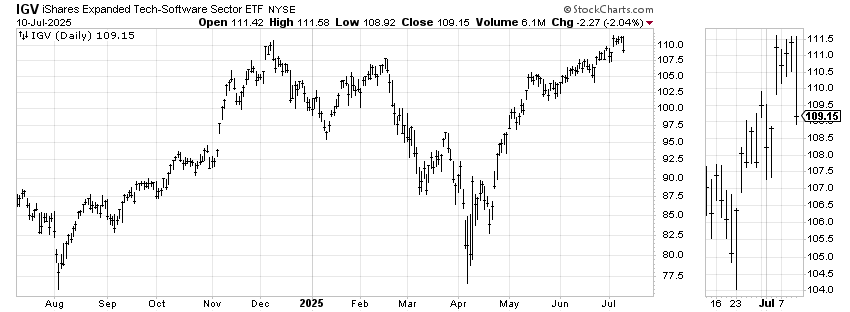
But let’s take a look at IGV, an ETF to be long software stocks. The ETF got hit for two percent on Thursday, essentially having stopped right at last December’s high. Take a look at the zoomed-in portion on the far right of the chart. There is a gap that is being filled right now from last Thursday’s gap-up on the Employment report.
I say pay attention to this because it ought to bounce from the gap fill, but notice that in December, it had a similar situation. It filled the gap, had a little bounce, and then continued downward. That’s why the next week or so is important for this group.
Is this just a shakeout or something more?
I say this because several of the winners of the rally off the low had similar action in June, only to get saved. That’s why the key is if there is a save at support or just a rest before heading down again.
If it’s the former, then the indicators, which are overbought, will probably not change. If it’s the latter, then I would expect the indicators to start to change.
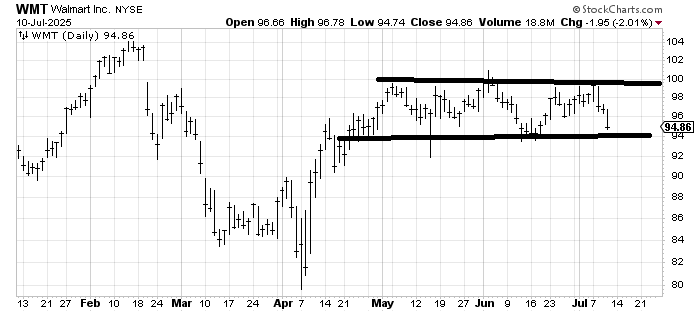
An example of a stock that threatened to break in mid-June is Walmart WMT. It has been my contention, since May, that this stock looks to be in a trading range between 95-100, which so far has been the case.
You see how it got saved from breaking in mid-June? And here it is retesting that area once again? A save keeps the indicators the same as they are now. If charts like this start breaking, the indicators will start to roll over.