What's Your Bias? Do You Follow the 200-Day or 6500 Support Level?
Is there any good that happens under the 200-day?
You've reached your free article limit
You've read 0 of 1 free Pro articles.
 Professional Stock Exchange Trader Performing Under Stressful Conditions. Stockbroker Talking with Business Clients on a Call, Working on Tablet Computer, Predicting Financial Data for Trading
Here’s a good test to tell if your bias is bullish or bearish. Do you care more about the 6500 support level on the S&P or the 200-day moving average on the S&P?
You see 6500 held Friday afternoon. Oh, it may still break this coming week, but if you are relieved that it held, you view the market bullishly.
The 200-day moving average line, which currently resides around 6620, broke on Thursday but closed right at it. Friday, it gave way, and we closed near the lows (not on the lows) of the day, thus rendering the break of the 200-day moving average line easy to see. If you are focused on that, then I would say you have a bearish bias.
There is an old quote from the famed trader Paul Tudor Jones that goes something like this: nothing good happens under the 200-day moving average line.
He is not wrong about that, but there are exceptions. First of all, on the left side of the chart of the S&P (below), you can see we got under it, whooshed lower for a week or so, and that was that. Oh sure, we didn’t get back over it for another month or so, but it was a whoosh with all sorts of indicators moving to an extreme.
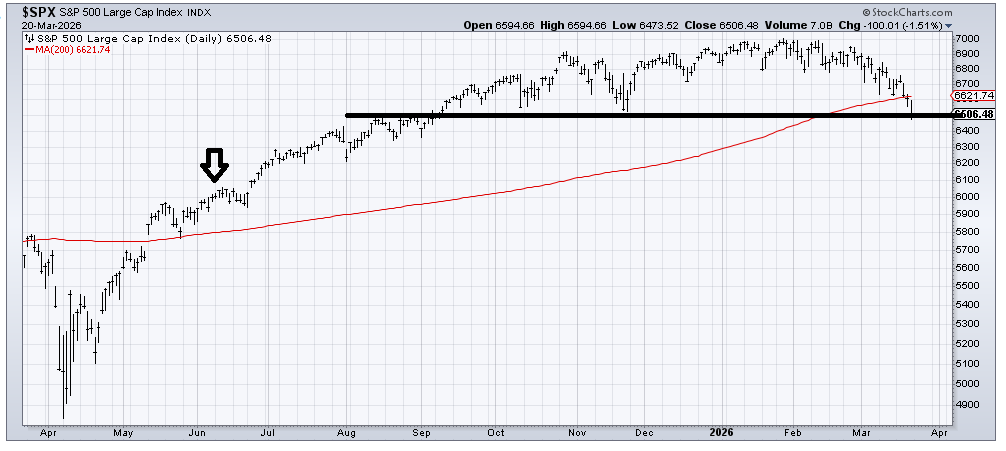
This current environment looks different than last year to me. The top in the S&P has been building for six months (last year it was about 2-3 months), so it’s been much more of a distribution phase (tends to be more long-term negative). Yet 200 trading days ago was June (arrow on the chart), which means the S&P is still trading higher than it was then, thus the moving average is still rising (when you replace a lower number with a higher one, the moving average rises). It is a lot easier to recapture a rising moving average than a falling one.
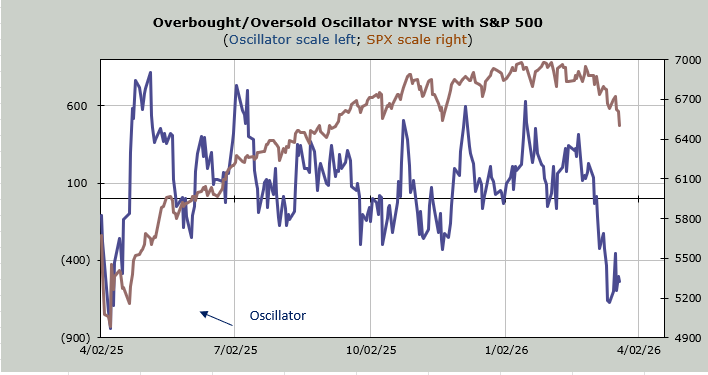
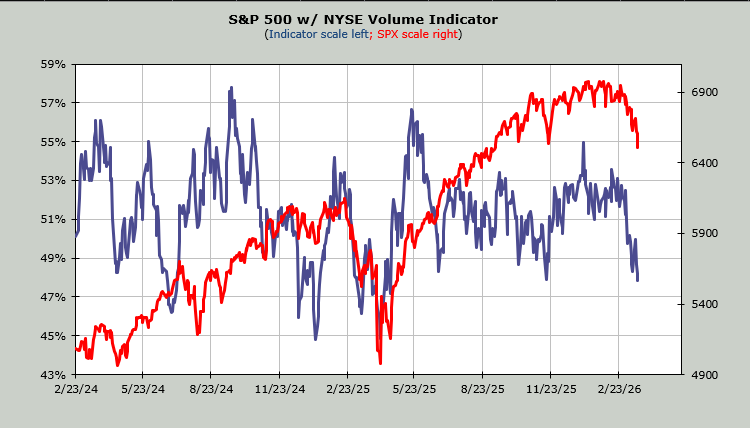
Now let’s move on to some of the intermediate-term indicators since we know the short-term ones are oversold. The Volume Indicator continues to reside at 48%. If you are trying to wrap your head around how that can be, let me report that the banks, semis, and (the real shocker!) the transports were all up last week. There was no wholesale selling; there was no day where 90% of the volume was on the downside. Thus, the indicator barely moved.
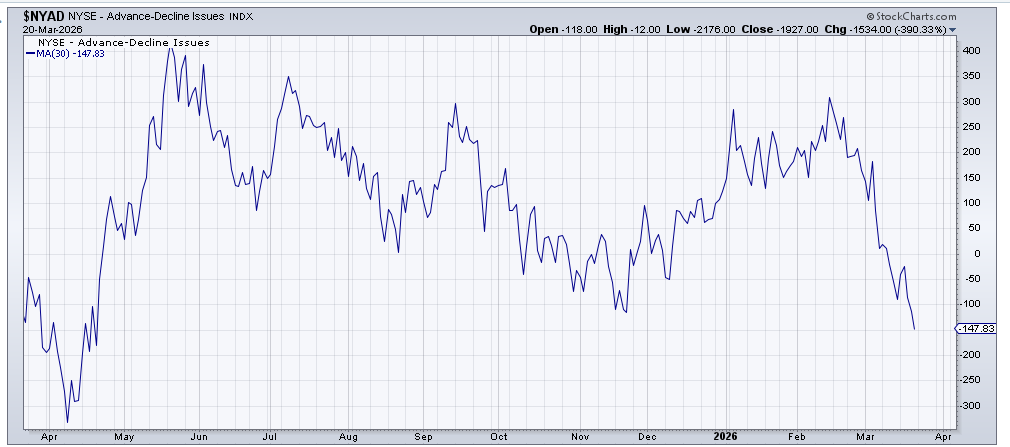
The 30-day moving average of the advance/decline line continues to look oversold, but the math behind it says no, since there are still positive numbers to drop. In fact, over the next two weeks, there are only two red breadth days to drop off this indicator. Thus, it is still not oversold.
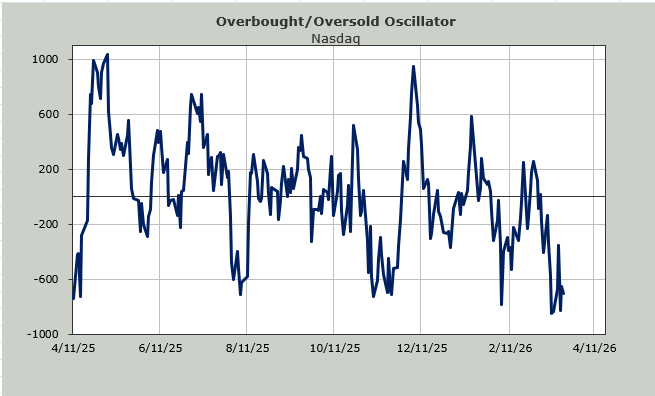
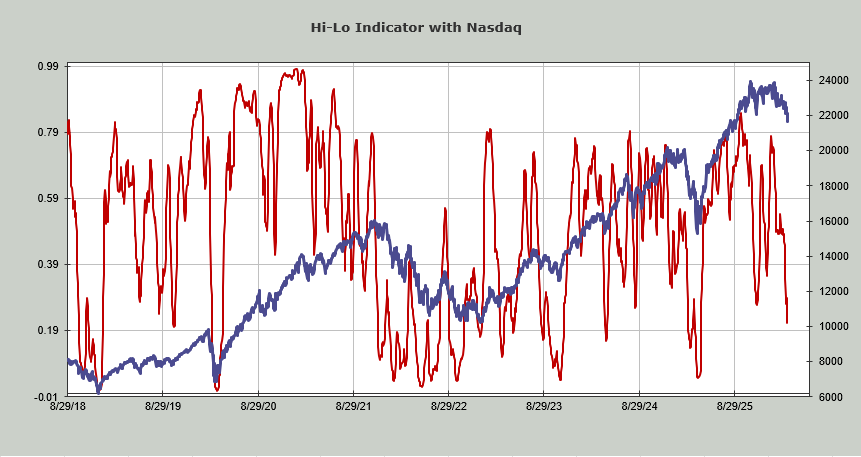
The Hi-Lo Indicator for Nasdaq is now at .21. That is likely mere days away from stepping into oversold territory. The NYSE’s Hi-Lo Indicator is still at .34 so it is not close.
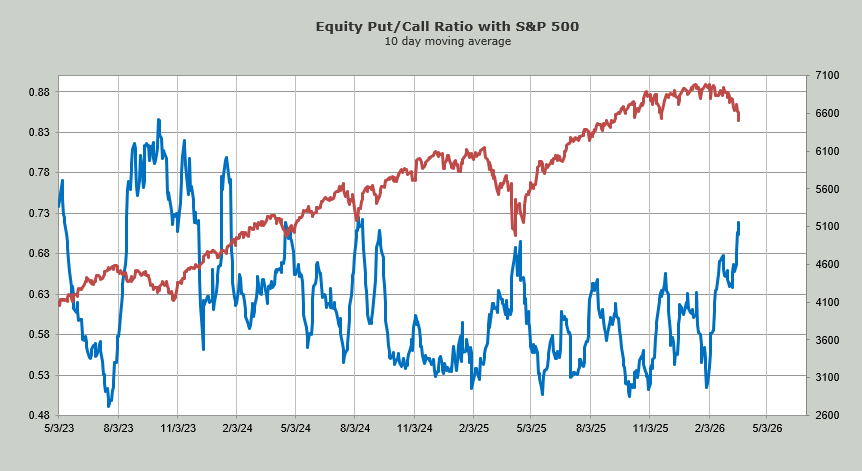
The ten-day moving average of the equity put/call ratio is now higher than it was in April of last year. It is now where it was in the fall of 2024. An extreme reading would be much higher (see the fall of 2023), but we can no longer say folks are complacent, even if there has been no panic.
Finally, the Daily Sentiment Indicator (DSI) is at 22 for the S&P and 25 for Nasdaq. A reading under 15 is a yellow light. A single-digit reading is an extreme. So you can see how an oversold bounce (we are still short-term oversold) and another trip down could get these indicators to an extreme. And maybe a break of 6500 would bring about some panic.