What's Next for the S&P 500 and Copper? Here's What We Expect to Unfold
The term 'risk asset' is hitting differently this week compared to last week.
You've reached your free article limit
You've read 0 of 1 free Pro articles.
Last week, market participants were focused on the reward that comes with taking on more risk, but I’ll bet their mindsets have shifted. They are now asking themselves how much risk is needed per unit of potential reward.
At the moment, the price tag is quite high.
This Feels Worse Than It Is
Stock investors have enjoyed two years of low volatility and blockbuster profits. We all knew this wasn’t healthy, but nobody knew when reality would set in. We do now.
The good news is the correction could be of the "rip the Band-Aid off" variety. Further, we have probably already experienced most of the pain.
Monthly S&P Chart
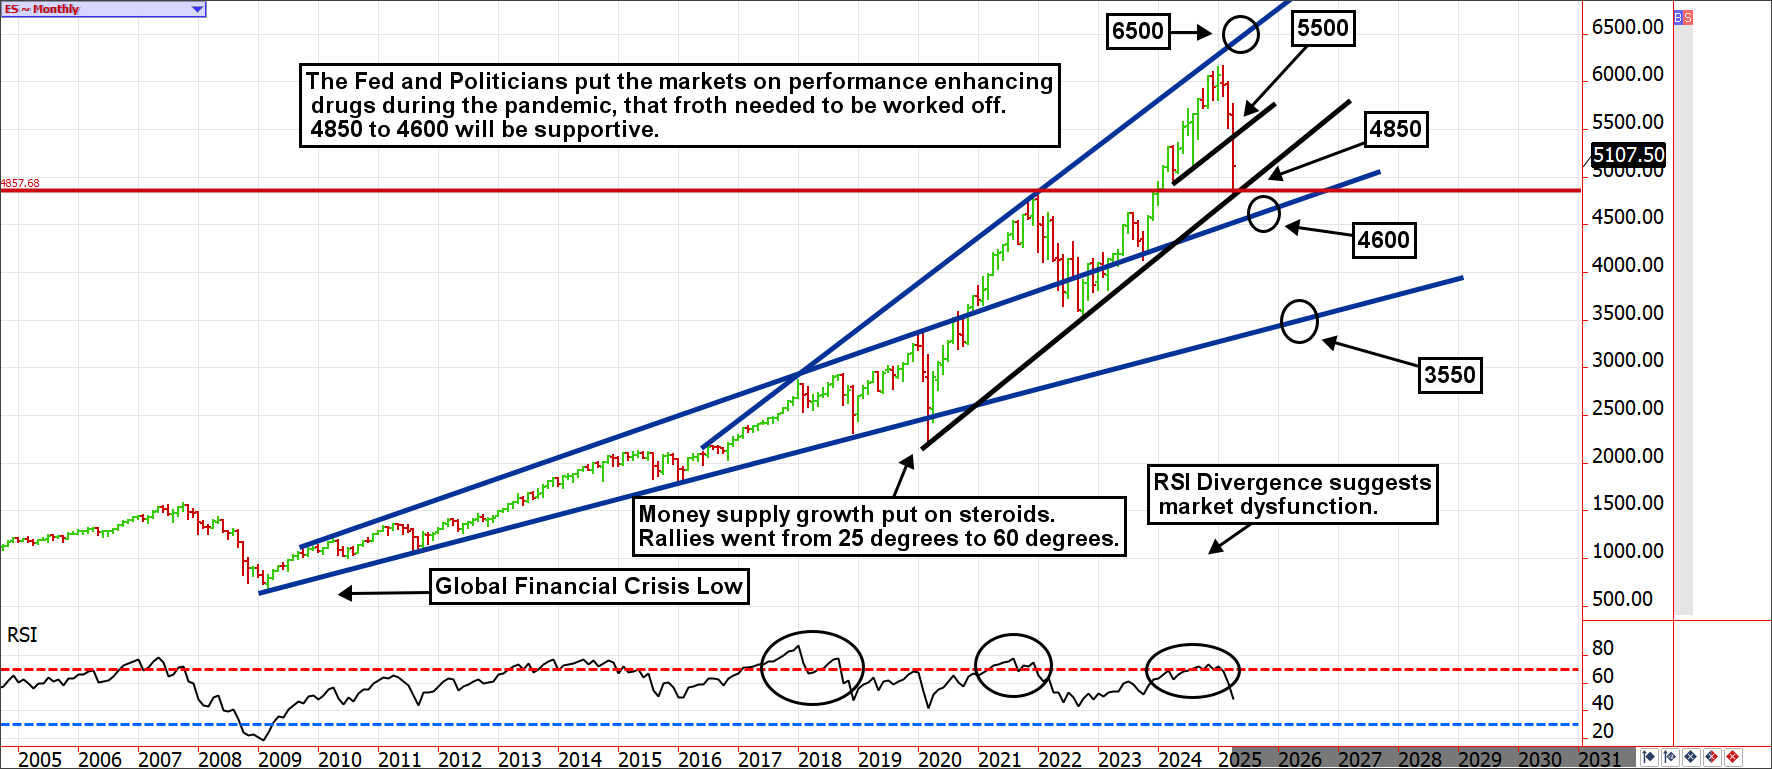
Following a slow-motion divergence between the RSI (Relative Strength Index) and the S&P 500 in which the RSI was making lower highs and the market was making higher highs, the April 6th Sunday evening futures low tagged 4832. This was just below the 4850-support offered by the trendline that started at the March 2020 low. Although dip buyers stepped in at that level, the odds favor a retest of that trendline or break to the 4600.
4600 marks the top of the trading channel (marked in blue) that existed from the Financial Crisis low, through the early days of the Covid pandemic. We believe the market would have respected that trading range (remained within it) had the pandemic stimulus not been on overdrive.
If 4600 fails to hold, the mid-3500s are in play. We are not expecting such a catastrophic event, but it is important to be aware of the possibility.
Dr. Copper Is on Life Support, but Not Dead
The copper market is often thought of as a bellwether of economic health, but we believe its indicative nature has been compromised. For instance, a few short weeks ago, copper prices were soaring on the premise of higher AI demand, a healthy economy, and the expectation of inflation. Rumors of tariffs targeting copper also played a role.
We put out an alert in early March, opining that copper had no business trading at those prices due to behavior in other markets (lower stocks and oil, which are signs of deflation).
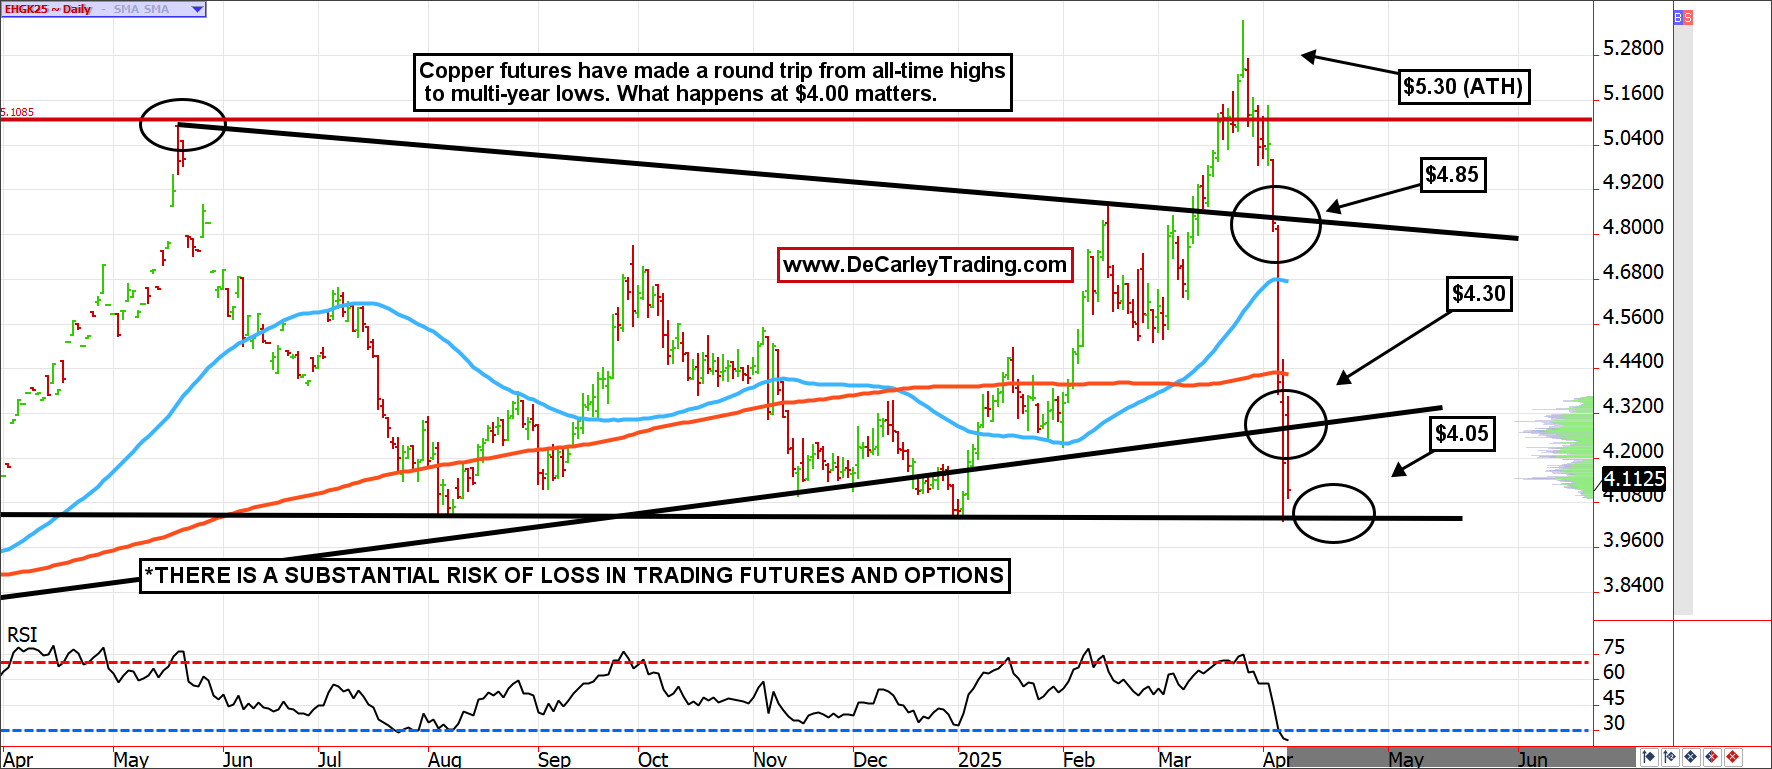
When it was least expected, the market conformed to our premise but made sure to shake our nerves and complicate our trades first. Nevertheless, the nearly immediate $1.30 retreat was only made possible by the irrational rally that preceded it.
Tariff hedges and speculative positions taken on the long side of copper pushed prices above their technical and fundamental comfort zone. Further, the Sunday night flash crash turned on a dime from the $4.00 area, which has been a base for copper for quite some time. If this area holds, as expected, it could be a sign of imminent strength in risk assets once the excess is worked out of the system.
Bottom Line
As you can imagine, we have been swamped, but we wanted to provide some quick thoughts on what has unfolded since the last article and what we expect to unfold in the S&P and copper in the coming days or weeks.
Of course, this is a market in turmoil, with participants feeling pain and panic; in such an environment, the wind can change directions without notice. I’ve lived through a handful of such market environments, operating via the quip that “less is more” is the only way to survive.
