What Does Panic Look Like? Here's My Checklist of What to Look For
If there was panic in the futures, then so be it, but it's what happens in the regular trading hours in the indicators that I'm focused on.
You've reached your free article limit
You've read 0 of 1 free Pro articles.
By now you should know what I am looking for when it comes to panicky action in the market. Will Thursday deliver?
There have been several questions asking if the after-hours action is what I would call panic? It might be. In the futures. But I don’t use futures. The indicators I use are not about price, they are what happens in the regular trading hours in the indicators.
In futures land we can’t see what percentage of the trading in stocks is on the downside. We don’t get a put/call ratio in the overnight session. So the answer is if there was panic in the futures, then so be it, but that’s not what I would look for on my list.
My list, as you probably know by now but just in case you need a reminder, includes most of the following.
I would like to see 90% of the volume on the downside. We have not seen that since December 18, the Fed Day that got everyone hysterical over three months ago. When people sell without distinguishing this from that they are panicking. And that is what brings a rush of selling that leads to 90% (or more) of the volume on the downside. When they are already picking through the decline to sort what they want to buy, they are not panicking.
Last Monday we saw 83% of the volume on the downside but that down open was quickly bought. As I noted at the time, it felt more like a panic to get in than one to get out.
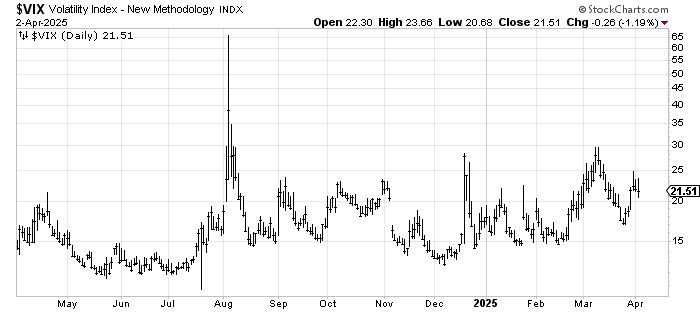
Next up I would like to see the VIX get jumpy. This is a very subjective point. Yes, the VIX got to 65 in August but it‘s less about the level and more about the look. Do you see the way it surged and looked as if it was breaking out? Sort of the way one of those penny stocks looks. That’s the look. So let’s start with a VIX over 30, but it’s more that it should look like it is breaking out of an extended base and that momentum traders would love to jump on the breakout.
I would also like to see the put/call ratio well over 1.0. At prior panics we’ve seen readings up in the 1.20 area. Thus far, since the high in February, we have seen exactly one reading over 1.0 and that was a measly 1.02.
When folks sell with wild abandon (90% downside volume) and they are buying puts fast and furiously we know there is a whiff of panic in the air.
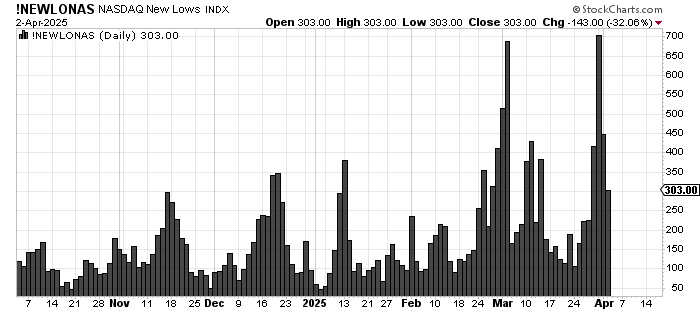
Of course if we get panic along with some positive divergence like fewer stocks making new lows, that would be a positive divergence. As a reminder, earlier this week the Nasdaq saw 702 stocks making new lows so that’s what we’re looking for: fewer than 702 new lows on the Nasdaq. For the NYSE that number is 289.
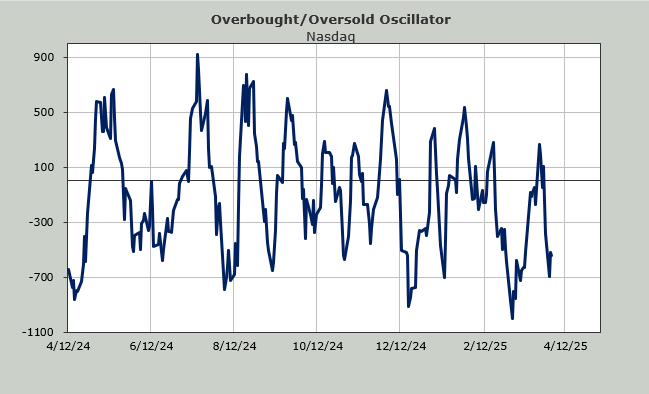
Without panic we get more of what we’ve gotten: chop until we use up the oversold condition.