We've Seen This Crude Oil Market Before and It Ended in Calamity
Economic weakness and the accompanying deflation pose significant risks for commodity prices.
You've reached your free article limit
You've read 0 of 1 free Pro articles.
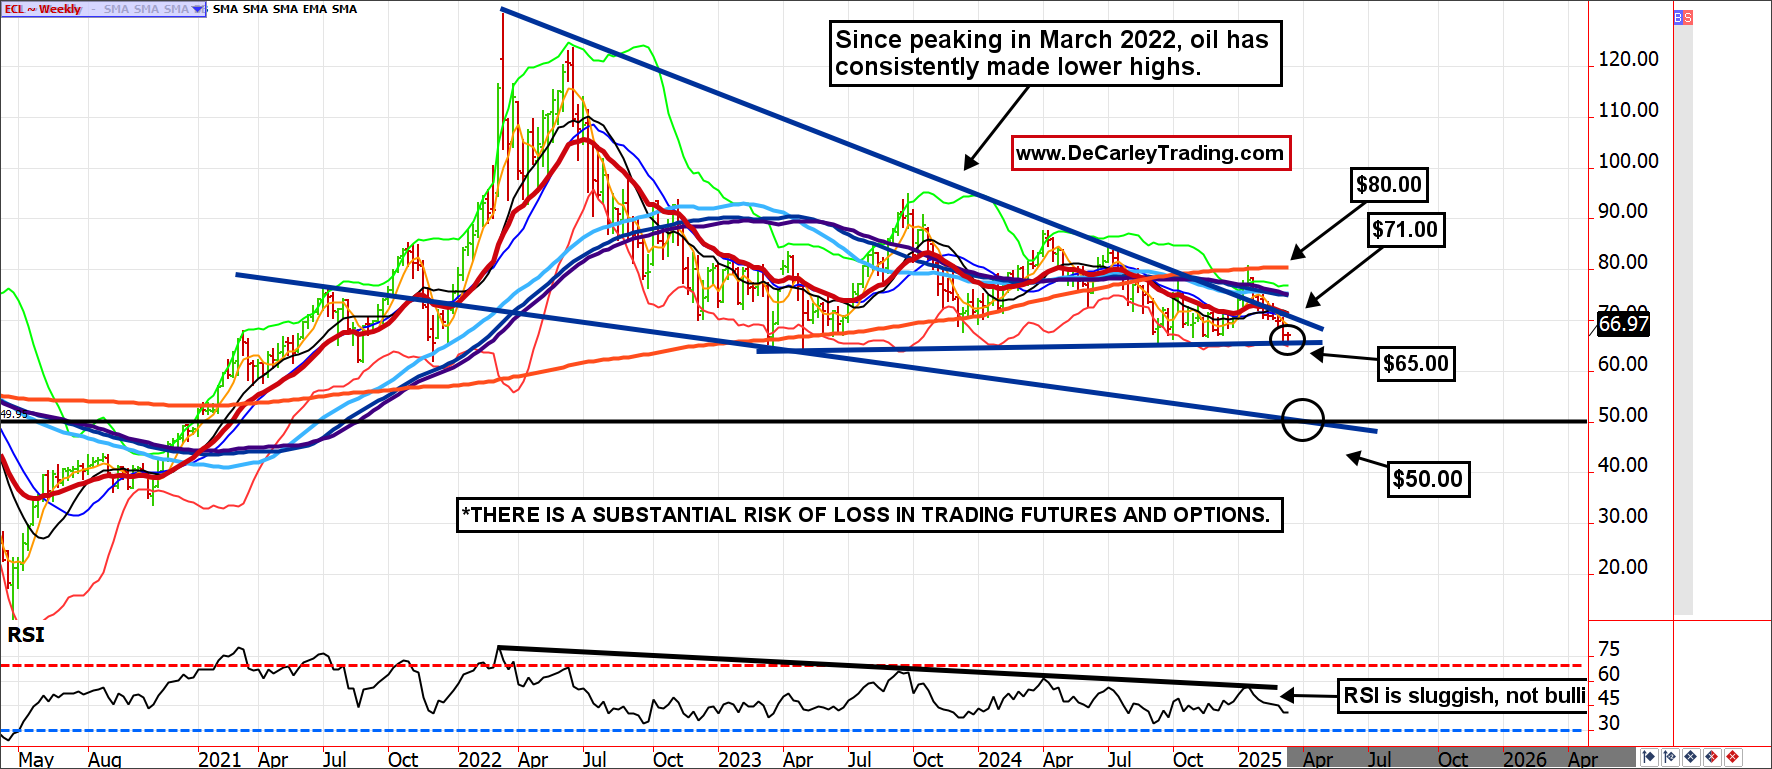
From here, we can see why traders are interested in being long the crude oil market.
The mid-$60s have been supportive for years. Both before and after the Russian invasion of Ukraine, the oil market has lured dip buyers in the $60.00 to $65.00 area. However, when a quiet market persistently challenges technical support levels without making higher highs on the rebound rally, the bottom eventually falls out. We suspect that is precisely what is in the cards for the oil market. Just a few months ago, the masses were focused on commodity inflation, but economic weakness and the accompanying deflation are likely more significant risks.
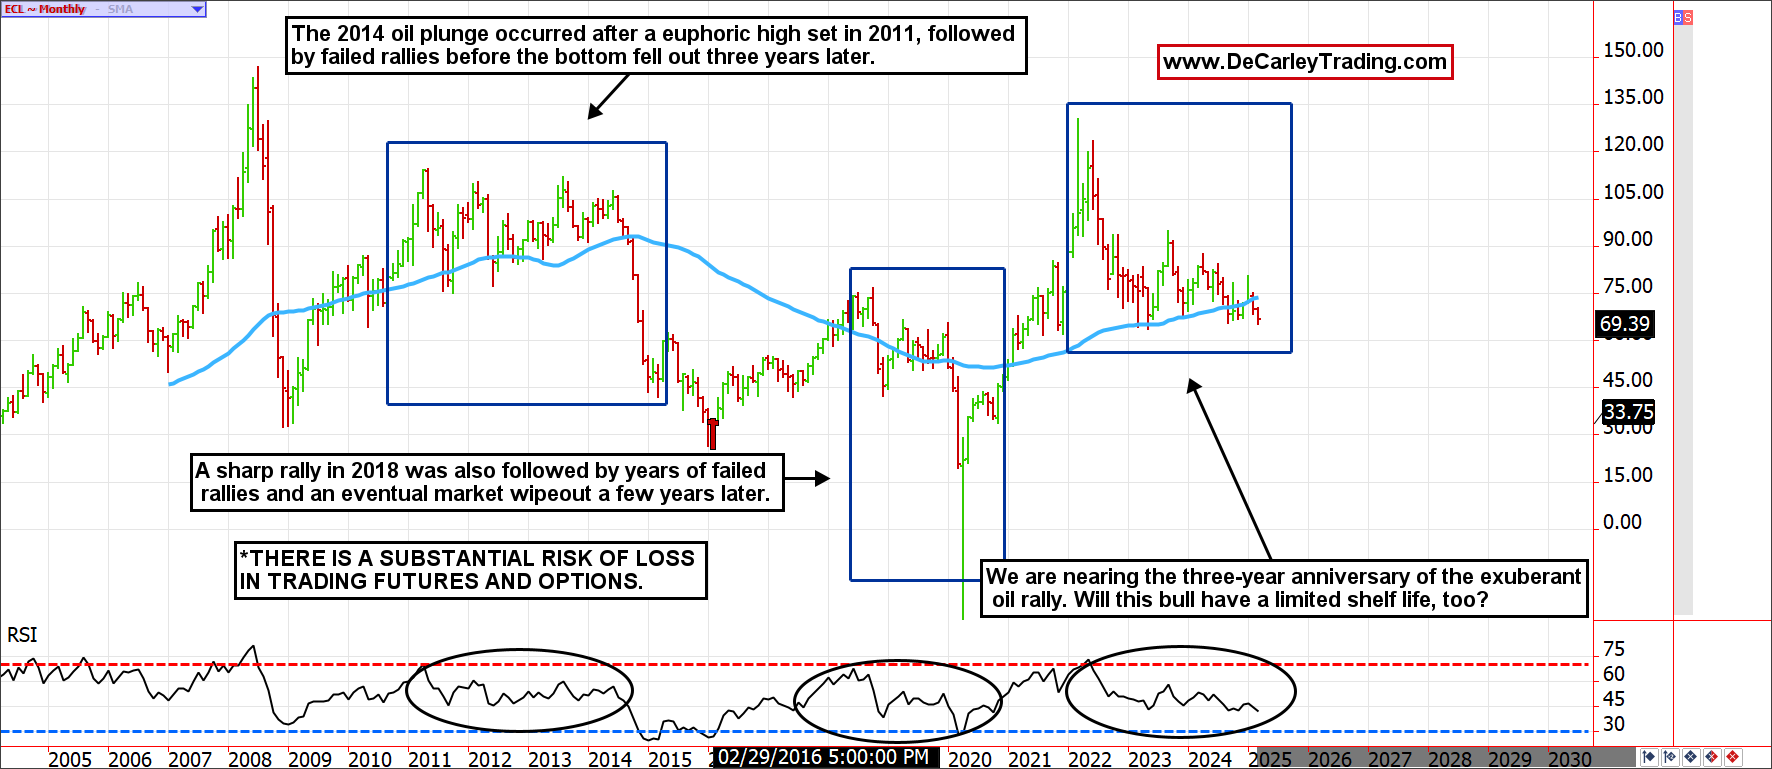
There are few benefits to getting older, but the one advantage of age is experience. We have seen the oil market behave this way before; it ended in calamity for the bulls. This doesn’t guarantee a three-peat, but it is worth noting and managing risk accordingly.
In 2011, the oil market attempted to regain pre-Global Financial Crisis highs but fell short. It then spent the next three years trying to assemble a meaningful rally, but each attempt was met with selling. Finally, the widespread advent of fracking allowed prices to slip decisively below the 58-day moving average to eventually shave 80% off the price ($114.00 per barrel to $23.00). A 2018 rally in oil repeated the pattern; two years of making lower highs ended in a pandemic rug pull. This time, the oil market started rolling over near $75.00 and, in dollar terms, gave back almost as much as the 2014 plunge, which brought prices below zero! In 2023, the price of oil peaked near $133.00. If it gives back $91.00 as seen in 2014, that puts oil near $42.00.
The monthly Relative Strength Index (RSI) also suggests that a repeat of 2014 and 2020 is possible and probable. Each scenario involved a spike in the RSI to 70.00 (overbought), followed by a sluggish RSI that dragged oil futures lower until finally bottoming out with a reading near 30.00 (oversold) — this metric of our analysis points toward continued weakness.
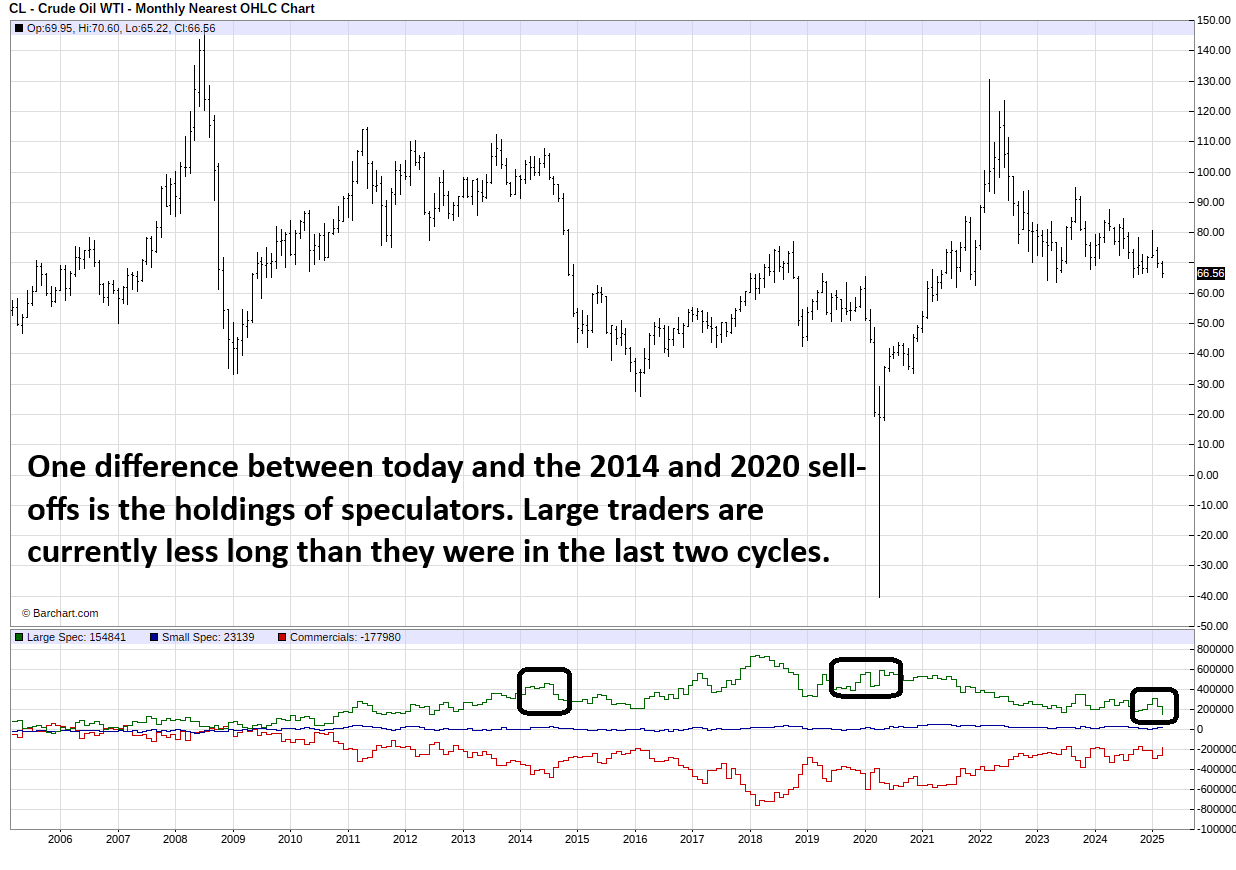
If the oil market suffers a sharp decline from here, the selling wouldn’t be as severe as the 2014 and 2020 sell-offs because fewer traders are long the market. Or at least, those who are long are holding smaller positions. Speculators hold roughly 200,000 net long futures as of the latest data, a third of what was carried into the 2020 debacle and half of the 2014 position. Thus, unless speculators actively go heavily short, another $15.00 to $25.00 could exhaust the selling.
Zooming in on the weekly chart, the multi-year downtrend and $65.00 support are apparent. What happens next is not. However, given the historical context offered by the monthly chart and weak RSI, we believe a break of $65.00 is the most likely outcome. If so, we have mapped out $50.00 as the target.
In the category of “if it were easy, everyone would do it,” if there is a fundamental change or something surprises the market enough to avoid a fallout and, instead, rally sharply ensues, the move would be of the rip-your-face-off variety. For this reason, it isn’t as easy as selling a futures contract and waiting for the windfall profits. There is a substantial amount of risk on both sides of the tape. We suggest option spreads with limited risk or micro futures. Good luck and stay safe.
