Weekly Wins: A New All-Time High for the S&P 500, but Should Investors Be Worried?
Let's take a look at the trend and momentum of the S&P 500 to see where the market might go next.
You've reached your free article limit
You've read 0 of 1 free Pro articles.
April 8th, 2025. Six days after Liberation Day, aka Tariff Day. Three trading days of pain. On that day, the S&P 500 traded as low as 4835 but reversed to close at 5062.
And it's barely looked back since.
Six weeks earlier, in February, I had looked at a chart of the S&P 500 and wrote that the Bollinger Bands signaled that a big move was about to come. I didn't like the market at that time because the Fear & Greed Index couldn't even get to a neutral 50 reading, even as stocks were setting new highs. That indicated that there was deterioration below the surface of the S&P 500.
Fast forward to today, when multiple indices set new all-time highs.
So, what better time to check in on the technicals?
A Technical Analysis of the S&P 500
This chart includes a 14-day RSI and the 50- and 200-day moving averages, and should tell us much of what we need to know. The moving averages help us to understand trend, while the RSI, short for Relative Strength Index, clues us in on the aggressiveness of investors, also called momentum.
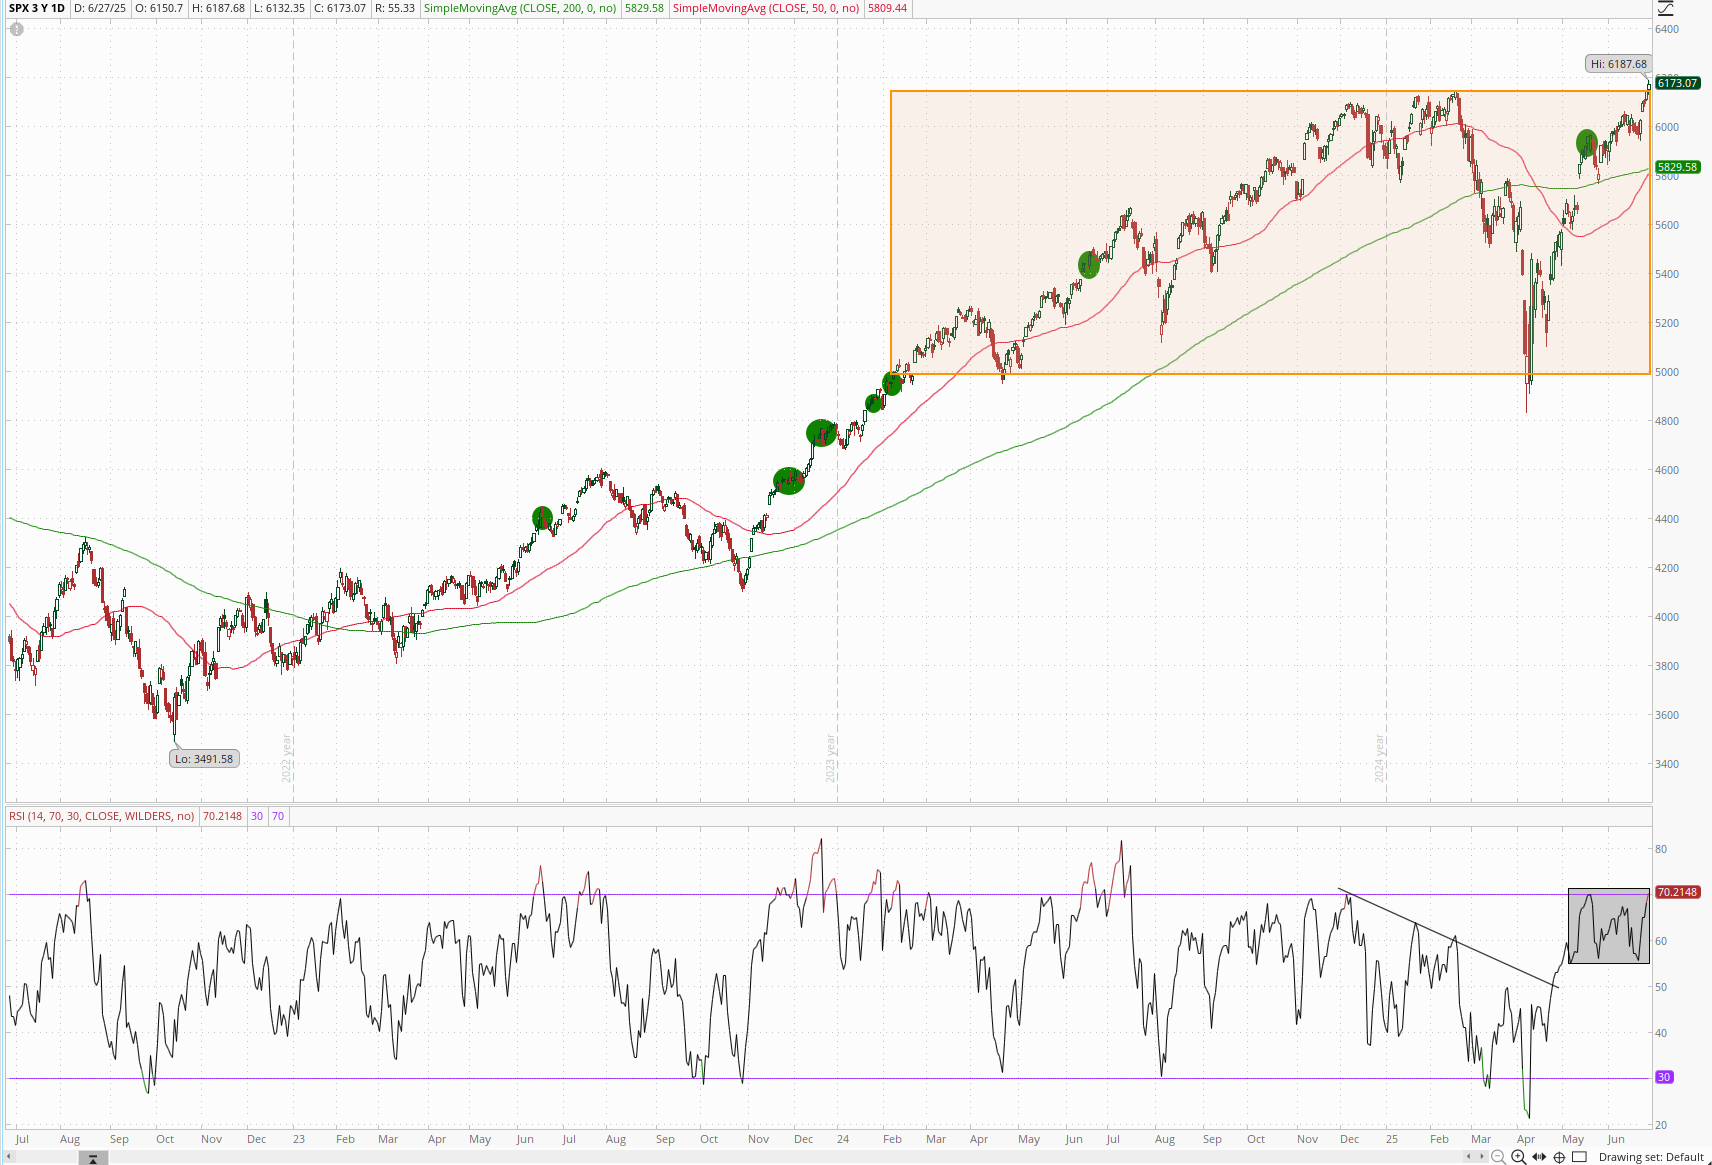
S&P 500 trend is up. We just set a new high at the same time that both the 50- and 200-day moving averages are upwards sloping. That's great!
But zooming out, maybe we're in a sideways trend (orange box). We're only just at, or slightly above, the old highs and the market mostly went sideways from just after the election until February. And then the April low found support at the low from a year prior.
Momentum is positive. Yes, the RSI is overbought. But often, an overbought RSI is a good thing. Notice the areas that I've circled in green. Each of those overbought periods came within an uptrend that continued, though sometimes after a pause.
Still, today's RSI gives me pause. Something has changed.
Notice the diagonal trend line I drew on the RSI from December through April? It's an interesting segment because, through February, the S&P was setting new highs, while the RSI was declining. That's a bearish divergence. Investors were getting less aggressive.
Today, we're setting new highs and the momentum seems very strong, but it's not getting stronger. I've put a box around the section of the RSI I'm referencing here.
Let's zoom out.
This is the same chart but using weekly data. The moving averages are now 50-week and 200-week averages. And the RSI is now calculated using weekly data.
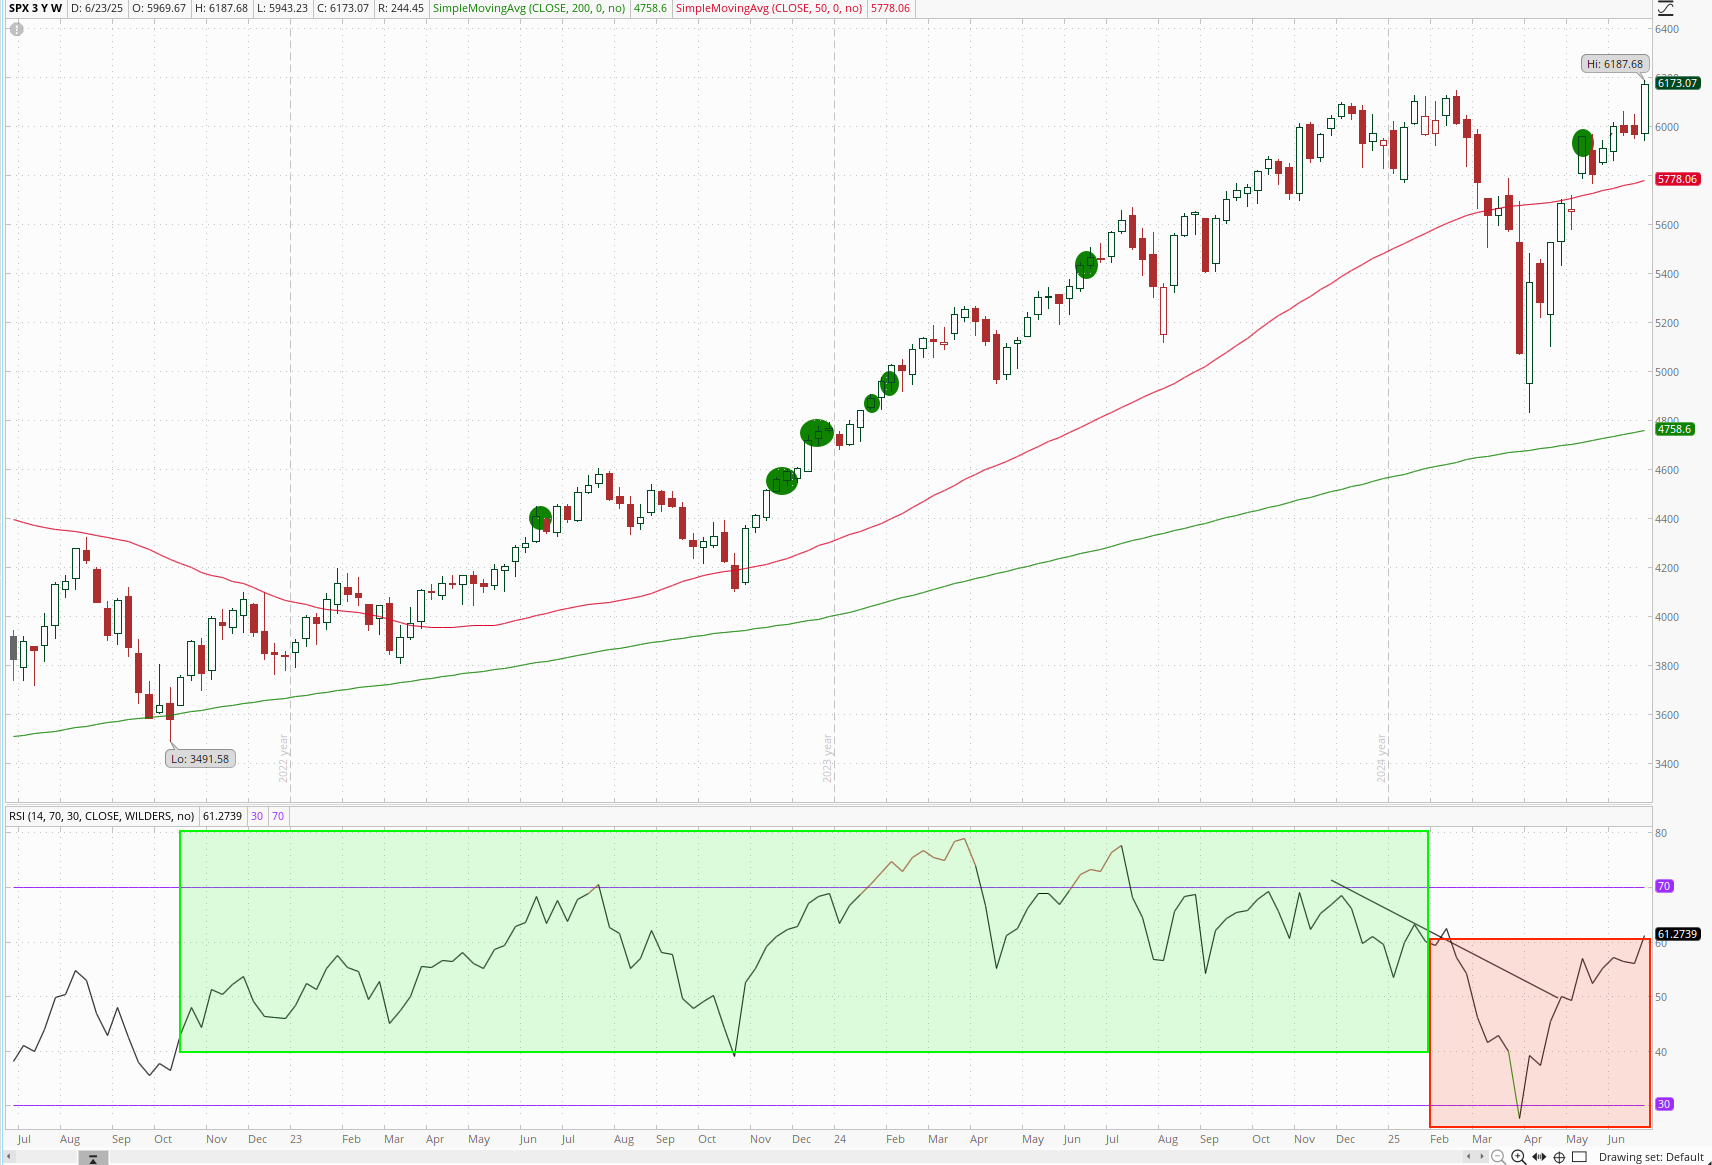
Andrew Cardwell is known for his RSI Range Rules. Basically, he says that RSI behaves differently in an uptrend vs. a downtrend.
Welles Wilder, who developed the RSI said that a security is overbought when the RSI is above 70 and oversold when it's below 30. Those are nice rules, but they were not designed for stocks. They were designed to be used with commodities.
Cardwell took a closer look and found that when a stock was trending upwards, its RSI would shift to move within a range of about 40-80. And when a stock was trending downwards, the RSI shifted to a lower range of 20-60.
In other words, in an uptrend, a stock would be overbought above 80, but in a downtrend, 60 would become the critical zone where it was overbought.
Remember that overbought doesn't mean a stock will fall. It simply means that investors have been too aggressive in their purchases. The stock may fall or it may pause. Oversold means that investors have been selling aggressively and may decide to buy, or they may simply stop selling.
You can see that in the chart above. From late 2022 through February of 2025, the RSI for the S&P 500 used that upper range, between 40 and 80. In late February, RSI suggested that something had changed, when it wouldn't confirm the S&P's new all-time high. It was starting into that lower range, where it continues today.
So, we're overbought on both a short and long-term basis, with reduced upwards momentum and the RSI is not signaling (yet) that we're in a new bull market.
How About Fear & Greed?
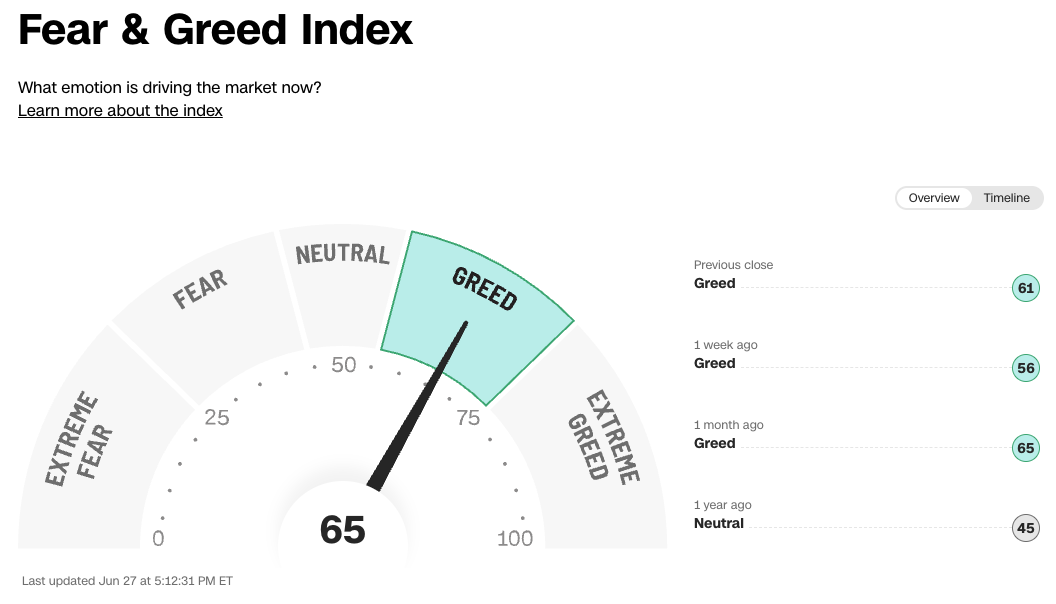
Much the same story as RSI, Fear & Greed seems unable to get to Extreme Greed.
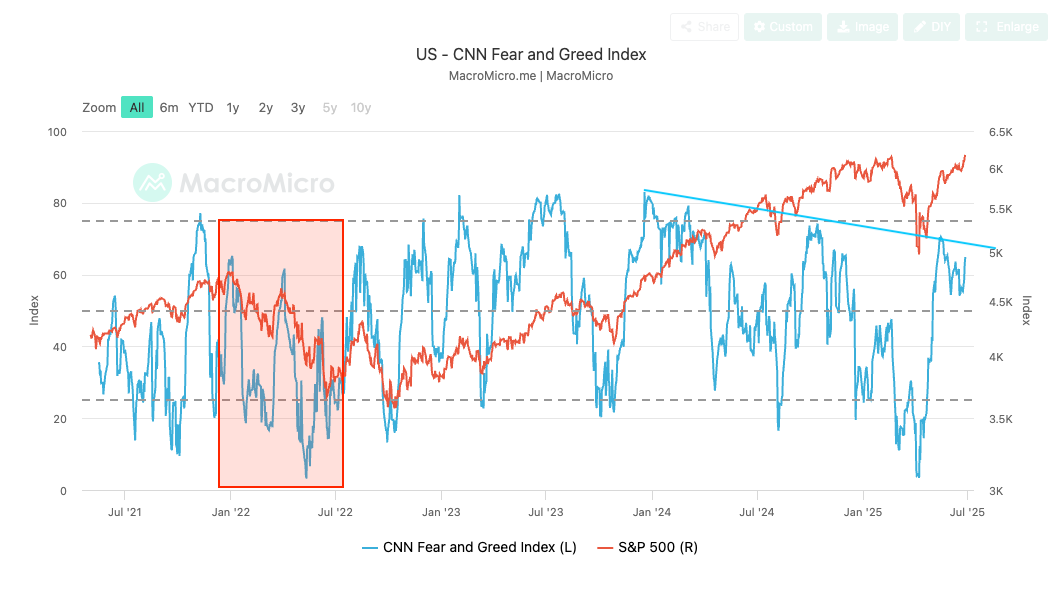
In fact, it's been more than a year since Fear & Greed has been above Extreme Greed.
Right now, the components all seem like they've got room to move upwards, if they want. Or, if investors are willing to commit money broadly to the market and not just to the mega cap names.
The stock market components of Fear & Greed are mixed. Market Momentum is neutral probably because, for the last two years, the S&P 500 has been much further above the 125-day average than it is now. That's a low momentum reading! The two breadth indicators rose from the April lows but have drifted sideways to downwards since May.
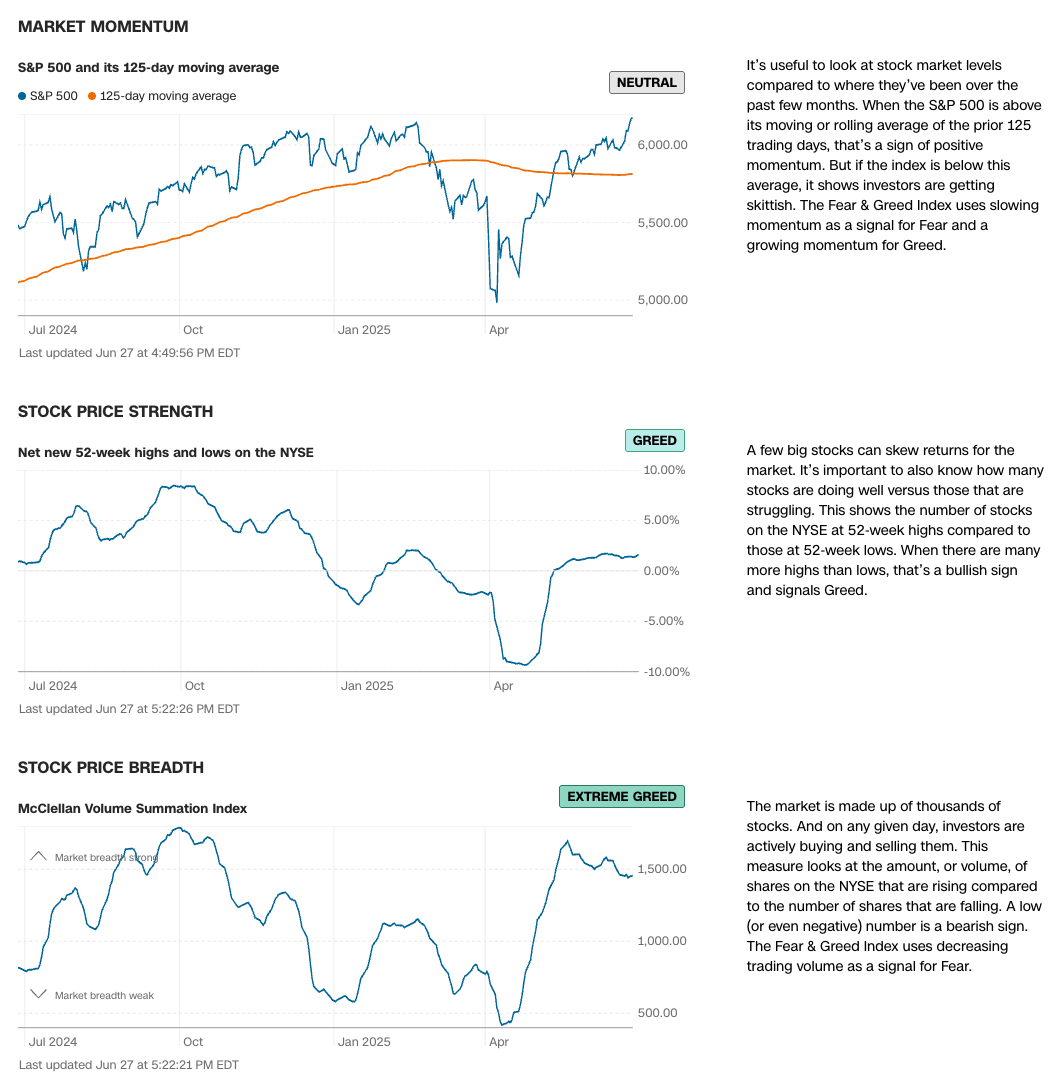
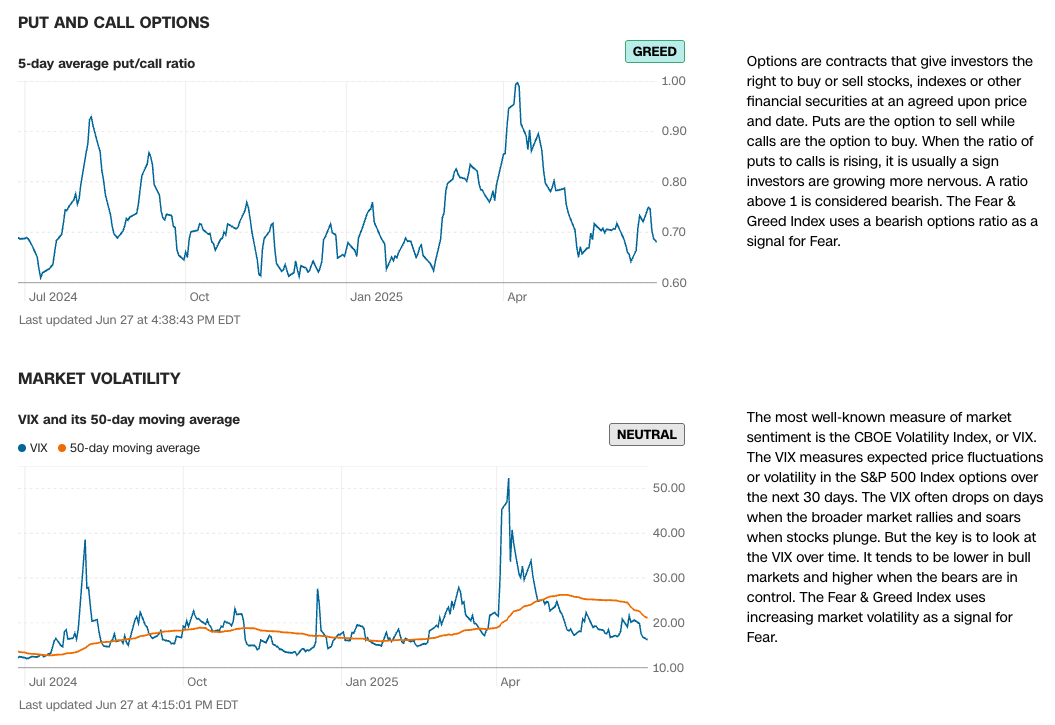
The options components are greedy, but not overly so. Put and Call Options are not at an extreme, and the VIX, is not currently offering a useful signal for Fear & Greed.
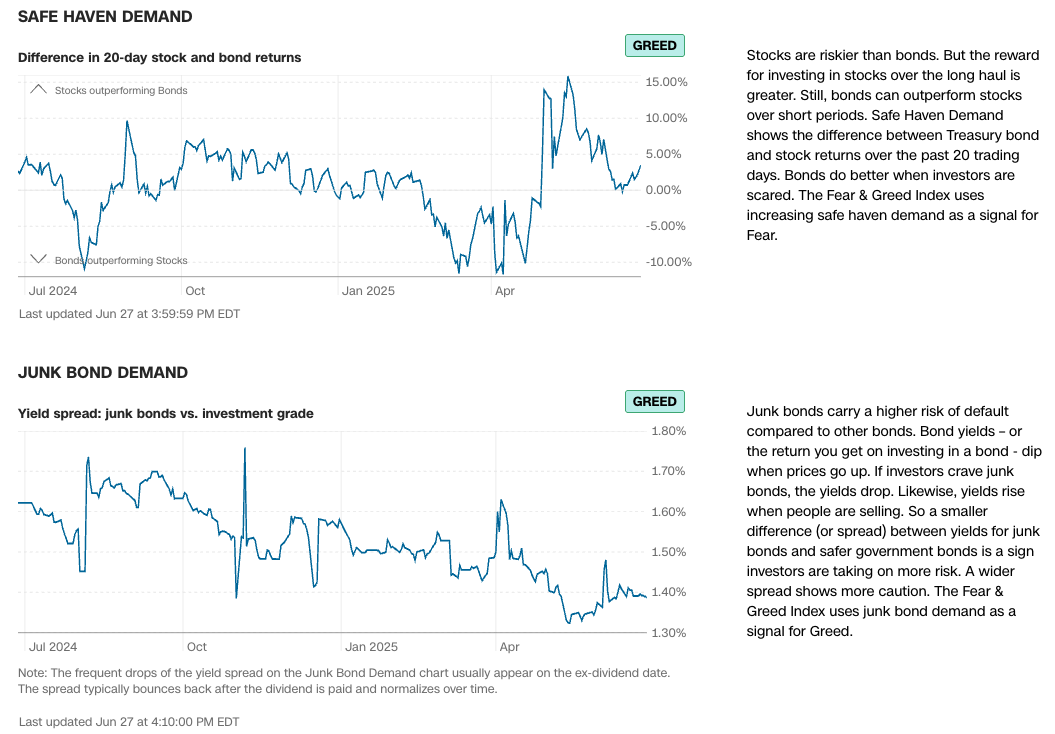
The bond market indicators both signal greed, but neither one is at an extreme level.
Breadth
Let's go back to market breadth. Who's doing well in 2025?
Heat Maps are useful visualizations. This one shows the year-to-date performance of every stock in the S&P 500.
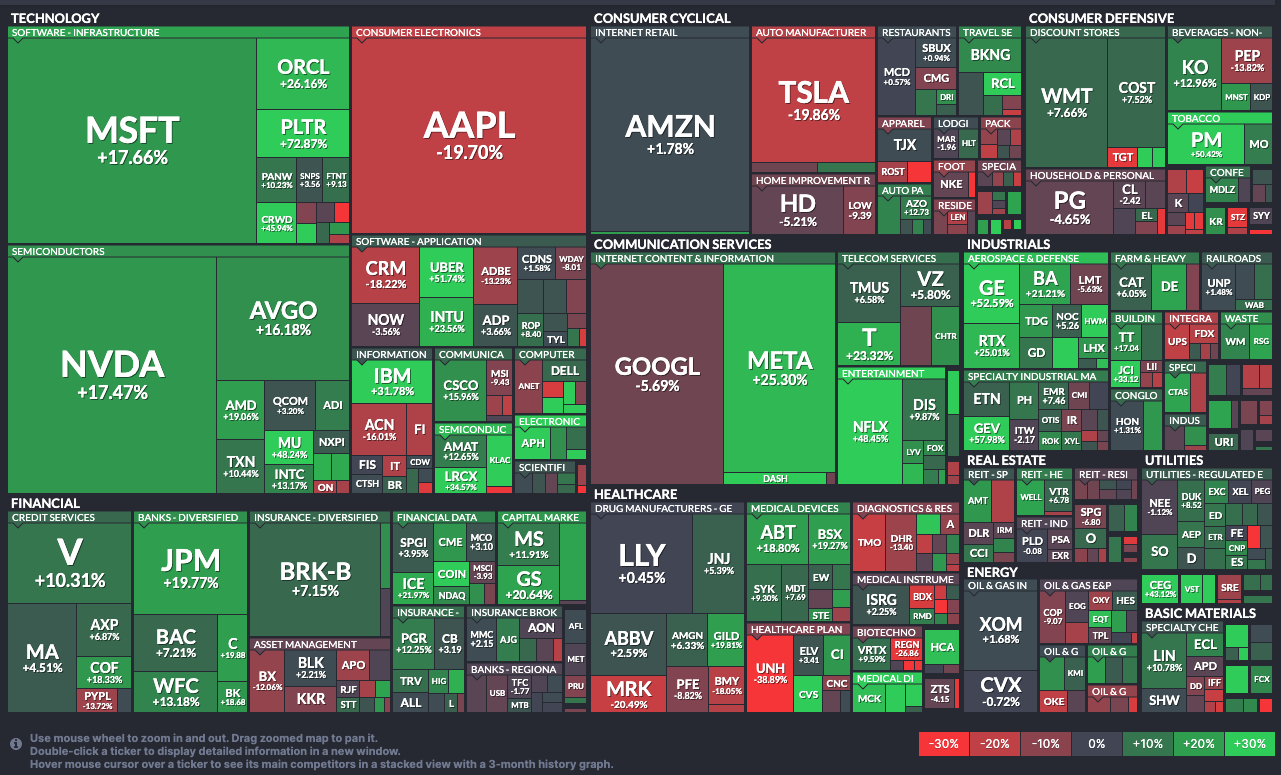
It's a little bit of a mixed picture. Sure, most of the mega-caps are doing well. But Tesla TSLA and Apple AAPL remain mired in bear markets.
Eight of the eleven S&P sectors are up on the year, with Consumer Discretionary down. And it's not just Tesla driving that sector lower. Home Depot HD and Lowes LOW are off, along with Nike NKE (which had a strong Friday) and even Chipotle CMG.
Since the April low, Tech, Industrials, and Communications have been the top sectors, beating the S&P 500's 22% gain. Healthcare has failed to rally.
Here's a multi-chart view of all 11 S&P sectors plus the S&P 500. The black horizontal line shows the closing price on April 2nd, Liberation Day.
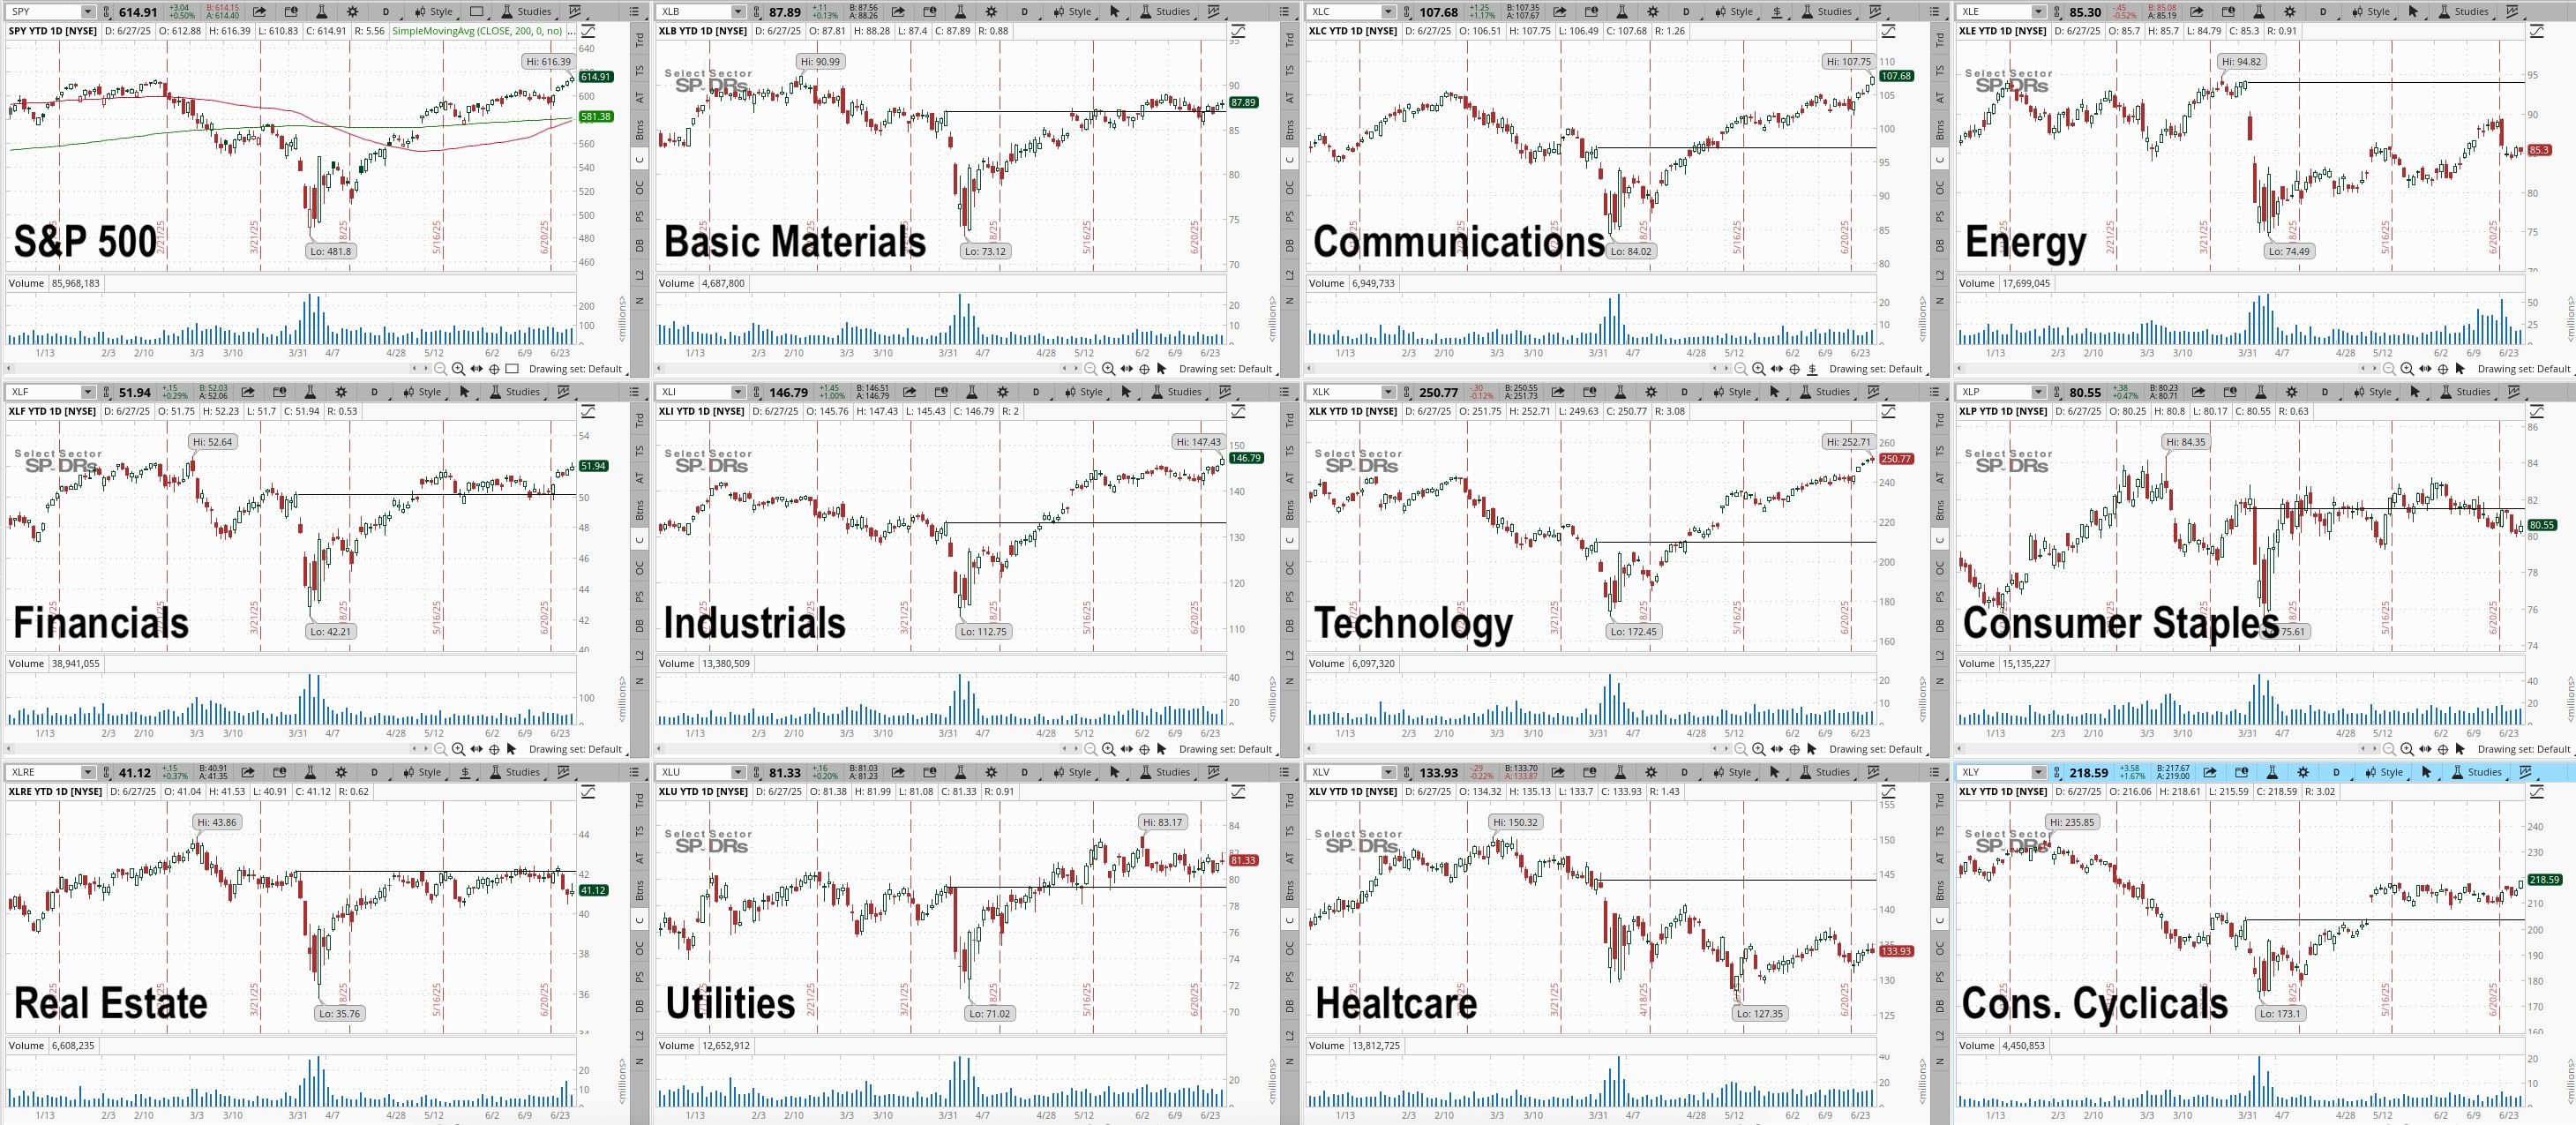
With the S&P 500 at a fresh all-time high, it's interesting that only three of eleven sectors are new highs and seven are either just above or remain below their pre-Liberation day levels.
Where Does That Leave Us?
Look, this market fell to its April low because of uncertainty around tariffs. It's rallying now because of more clarity around tariffs, hopes of tax cuts, and prayers for rate cuts.
Is that healthy? I don't know. Maybe? Regardless, the S&P is anything but undervalued. So, if tax cuts and rate cuts juice earnings and tariffs don't hurt them, then I guess the current valuation in the market is warranted.
But risk is anything but low right now.
Have a great weekend.
