Volatility Rises—but Tech Selling Doesn’t: What the Indicators Say Now
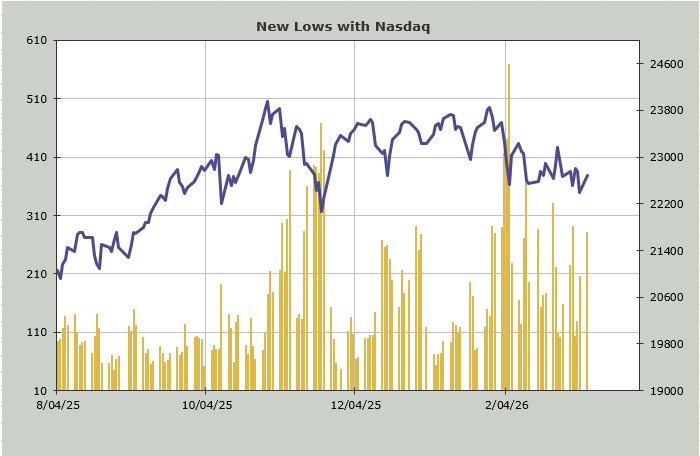
Even with a jumpy VIX and a late‑day reversal, Nasdaq new lows remain contained, signaling that selling pressure in growth and software may finally be drying up.
You've reached your free article limit
You've read 0 of 1 free Pro articles.
 8-3-25-chinese-stocks-nosedive-beijing-measures-not-stemming-the-selling
For the last week, as the 493, or perhaps we’ll call them the non-growth stocks, collapsed, we saw software/growth rally. Monday was no different. Until the late-day turnaround. In the late-day turnaround, it wasn’t software that got scooped up. It was what had been killed the week before.
Now all rallies start with short covering, but this was yet another move of violence. We ran in shorts in the 493, and what a rug pull we had in oil. More violence. But did it change the indicators? I must report it did not.
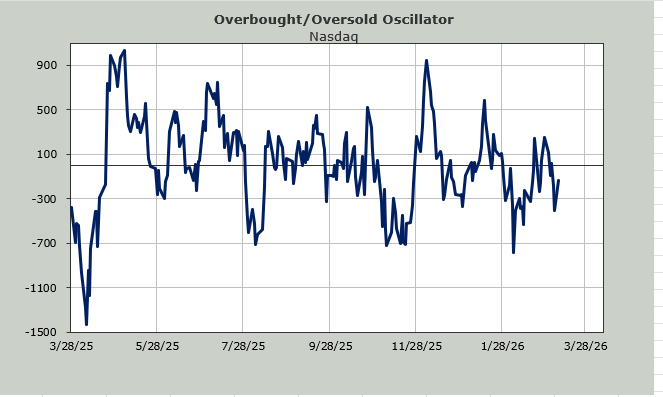
But notice that once again, the number of stocks making new lows on Nasdaq did not expand, despite the early morning whack. For the time being, I will reiterate that I think the selling in these growthy/tech names is mostly done. That doesn’t mean we won’t see any more downside—I suspect when everyone decides they are back in the pool, we will see some downside again there—but for now, you can see it on this chart: the selling dries up when Nasdaq goes down.
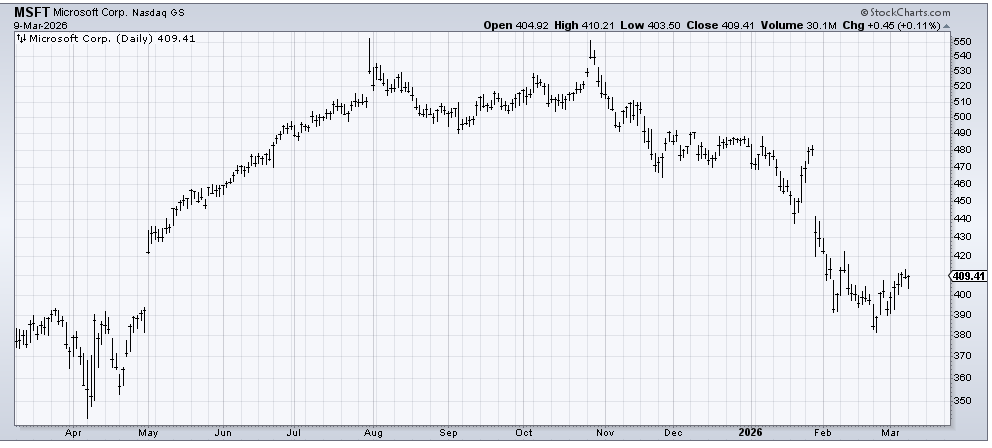
Let’s look at Microsoft as an example (and one of the largest holdings in IGV). It has been shuffling back and forth between 390-ish and 420 for five weeks now. The closing price over the last few days has hovered around 409. That means that despite Nasdaq declining 58 on Thursday, the stock closed here. Despite Nasdaq losing 360 points on Friday, the stock closed here. And despite Nasdaq gaining 300 points on Monday, the stock is still here.
But do you see how a pattern begins to emerge, now that we are in week six? It begins to look like a small bottom (very small). With each day that passes, the chart begins to feel sturdier, even though it hasn’t gone anywhere in weeks.
I think software stocks in general are a little overbought, so I would not be surprised to see some pullbacks this week, but I think we should start to see patterns emerge and differentiation develop in them.
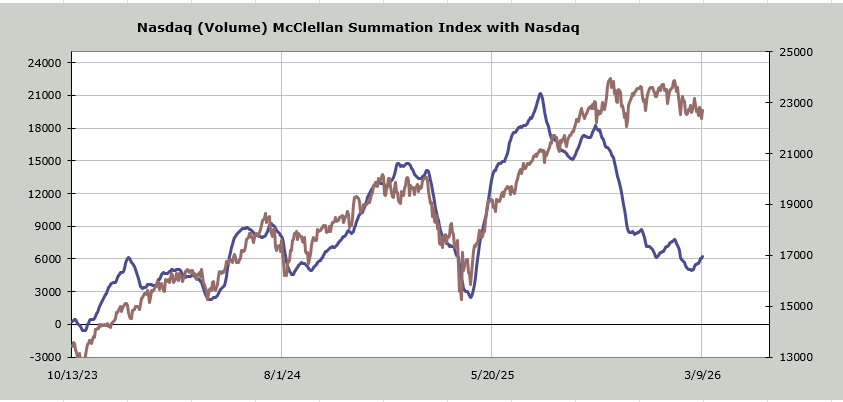
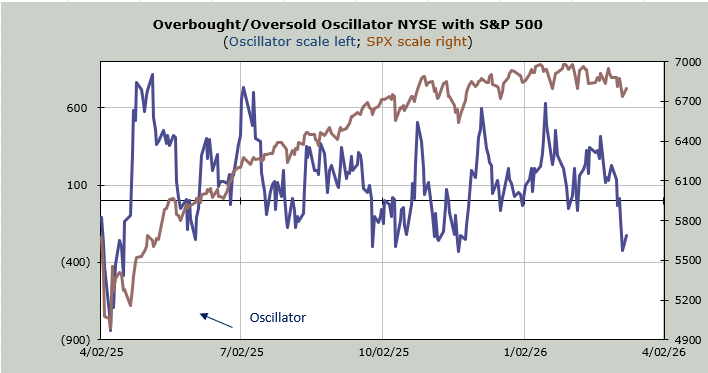
And the number of stocks making new lows is shrinking, which tells us there are other stocks out there like that. Then there is the Nasdaq McClellan Summation Index, which turned upward over a week ago. Throughout this latest decline in the market, it has held tough. In fact, it looks like the inverse of the NYSE Summation Index (which mostly represents the 493).
Even the VIX got a little jumpy on Monday, although we did not see the panic selling that we had last Monday. Last Monday, we saw 91% of the volume on the downside in the early going, and this week it couldn’t even get to 70%. I still think we’re in an Either/Or market.
Related: Feeling Like Michael Burry — Is the Market Finally Ready to Listen?
