Trading Volume Soars, but the Panic Just Isn't There
Does this mean stocks aren't oversold enough to rally?
You've reached your free article limit
You've read 0 of 1 free Pro articles.
Is it possible that despite all my short-term indicators—okay, not all but most—saying we are oversold enough to rally, we don’t/can’t rally? Sure, it is possible. Nothing is perfect. And I would remind you of the chart I posted here a few weeks ago from March of 2002 when then President Bush instituted steel tariffs, and the market cracked and headed south for four months.
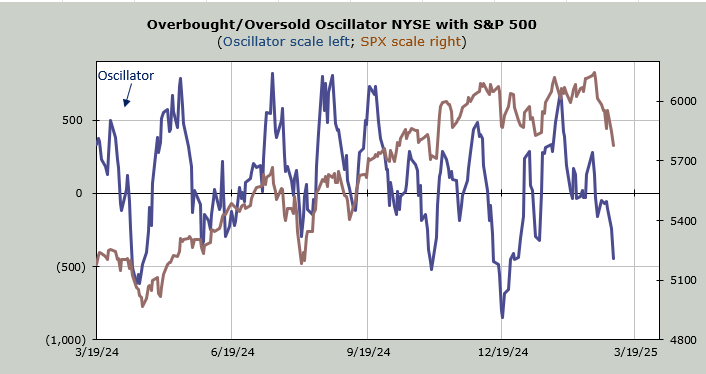
But I still think we are short-term oversold enough to rally. I do not think we have had panic. We have not seen a 90% down volume day. We have not seen the put/call ratio get up over 1.0. We have not seen the VIX get jumpy. And we certainly haven’t seen CNBC do a Markets in Turmoil special.
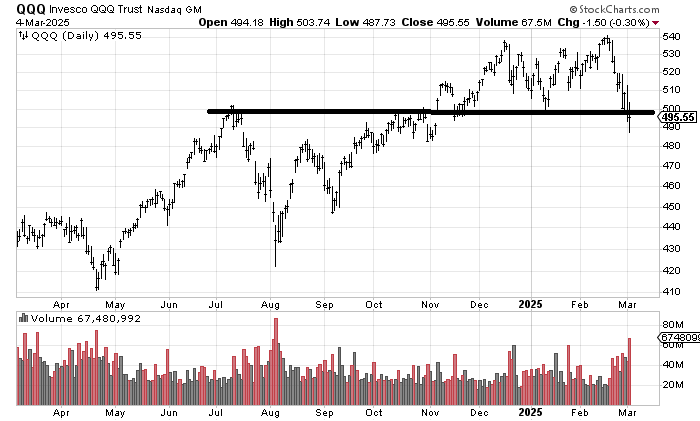
But we did see the QQQs with volume over 60 million shares for the first time since August. High-volume moves tend to show up near the end of a rout –or at least short term—rather than the beginning.
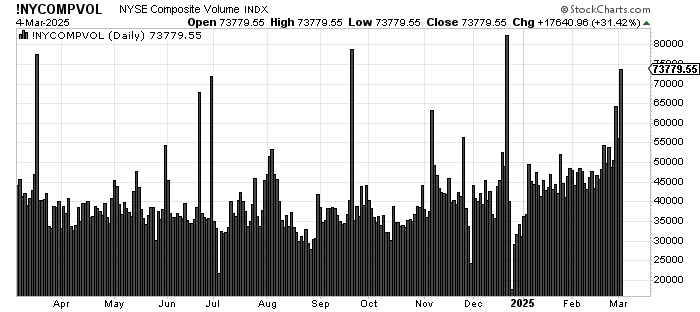
We saw the NYSE with 7.3 billion shares traded. We spend a lot of time talking about the Nasdaq volume but very little discussing the NYSE because it is so steady and constant. Just take a look at the volume through January and most of February: between 4.5-5 billion shares every day. But now notice the last two days: up and out of the range.
All those other spikes you see on that one-year chart are rebalancing or quarterly expirations. So yes, there was some decent volume on Tuesday.
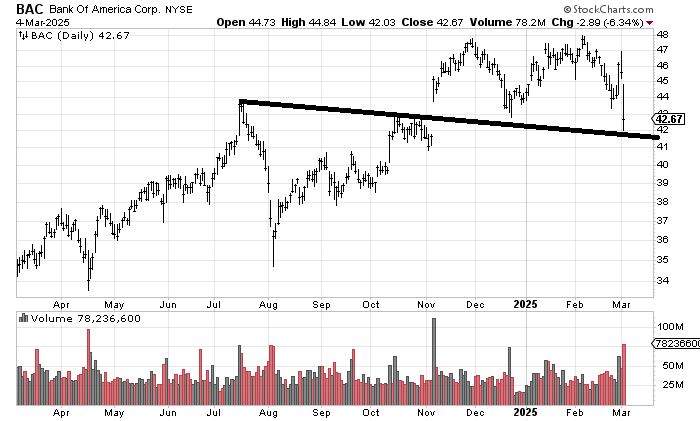
Much of that volume was in the financials. For example, Bank Of America (BAC) traded 78 million shares, the most since the gap up after the election. I do not like the chart, but it did fill that gap, and it does have some support here. But the point really is there was some size selling on Tuesday.
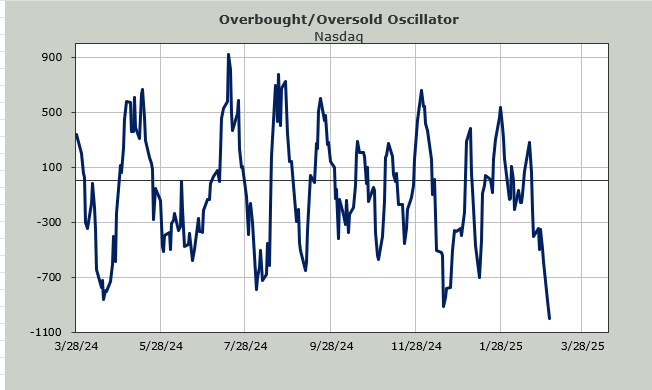
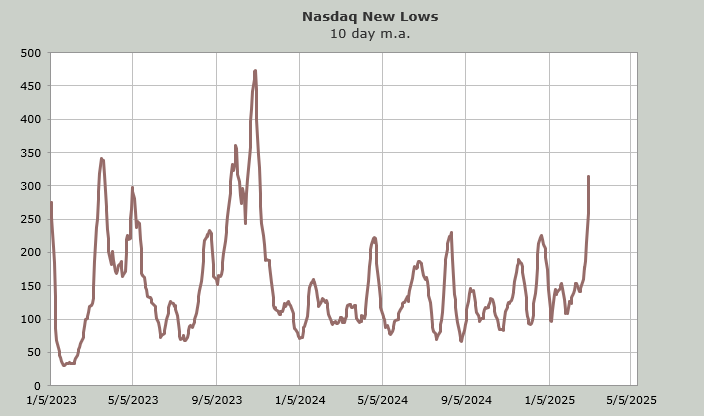
The number of stocks making new lows continues to expand. Nasdaq had almost 700 stocks make new lows. That’s a lot. That means there is no positive divergence (fewer new lows is a positive divergence), and you can see on a ten-day moving average it is now over 300. It was 450 at the October 2023 low. This is not bullish except that it, too, tells us how much selling we’ve seen.
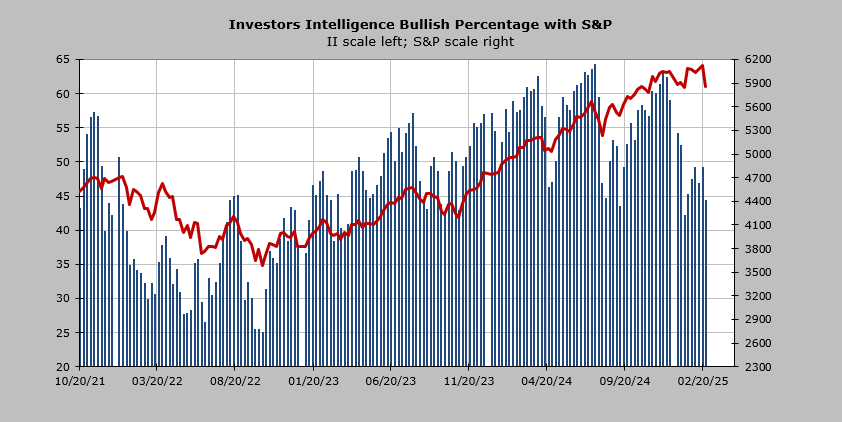
On the sentiment side of things, as I said, I do not see panic, but last week saw the Investors Intelligence bulls at 44%. I will be very surprised if they are not lower this week, although they probably took Friday’s rebound into consideration. But if this falls under 40%, I would not consider it extreme, but I would say at least we finally have another sentiment indicator that is lining up with the AAII reading.
For those who have asked, the Daily Sentiment Index (DSI) is 42 for the S&P and 40 for Nasdaq, so they, too, are not showing a whole lot of bearishness as they remain in the neutral zone. Under 20 and they would be in the 'getting close' category.
I still think we are due a short-term oversold rally.