Thoughts on Why This Has Been Among the Most Interesting Periods in My Career
Many of the moves that this market has produced have been unprecedented.
You've reached your free article limit
You've read 0 of 1 free Pro articles.
 About-Top-Stocks-Helene-Meisler
This has been one of the most interesting periods in my career in the market.
As we entered the year, I thought tech stocks were lagging and vulnerable. You might recall I was positive on charts like the materials and drugs and staples, and transports. But if you had asked me in early January what I thought the indexes would do if tech went down, I would surely have said the S&P would have backed off much lower than 6800. Yet that is not what happened.
Instead, we had violent moves to the upside in so many stocks except growth names. Growth names crumbled. And the S&P stayed put. In fact, we had had a wide range (6500-7000) as we entered the year, and it got even narrower as the calendar turned to 2026, with the lower end of the range lifting to 6800.
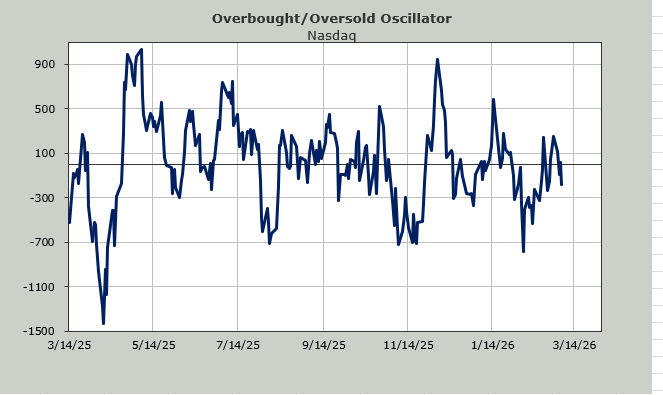
What’s more, Nasdaq, where so much of that growthy stuff resides, couldn’t manage to break 21000. There is no way I thought that would be the case.
So this Either/Or market continues with growth now rallying, and the 493 backing off. Sure, it’s what I thought would happen, but again, the violence that we’ve seen both in the software stocks rallying and the others falling is something to behold.
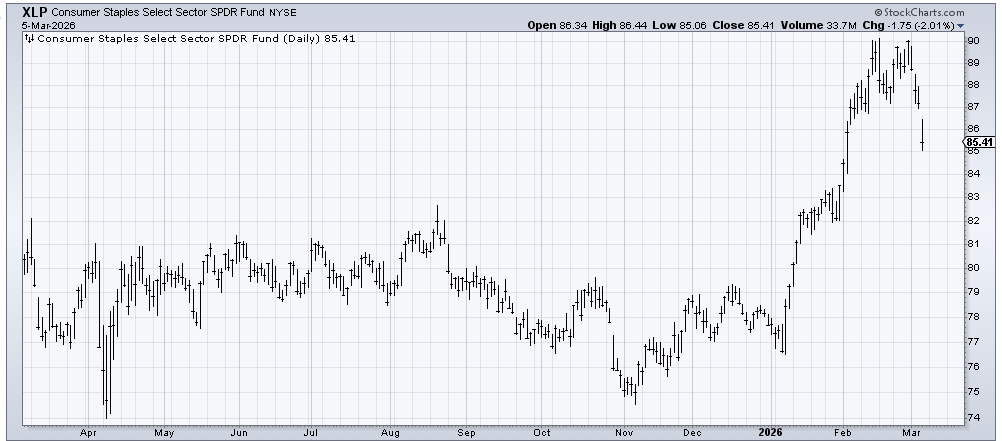
Sure, I said earlier in the week that I did not like XLP, the ETF to be long the staples, but did I expect such violence on the downside? And such violence with the S&P still firmly clinging to 6800? No way.
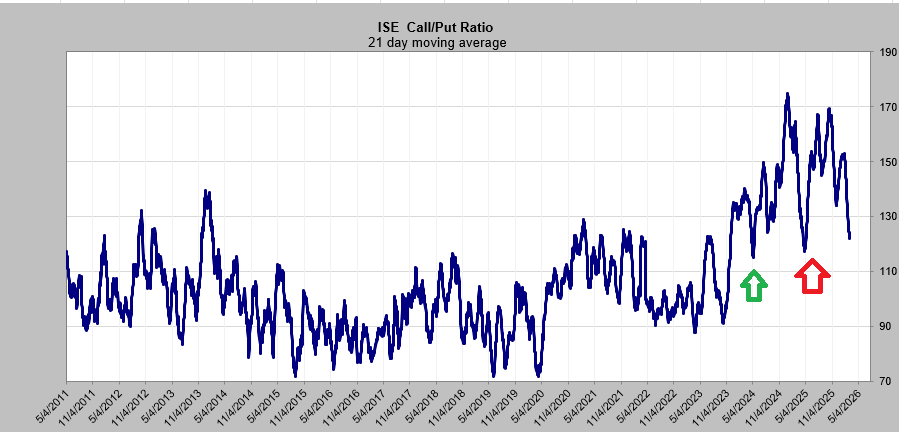
And if you told me that tech stocks would rally this week, I would have thought for sure the call buyers would be back in action. But that is not what has happened. I have spent a good deal of time in the last month discussing sentiment. I thought it was related to the collapse in the software stocks. I’m sure much of it was, but the 21-day moving average of the ISE call/put ratio continues to fall.
The green arrow is late April of 2024. I cannot even recall what had the market upset back then, but the S&P fell by 6 percent in two weeks (was it the Silicon Valley Bank collapse?), so you can understand this indicator falling to 1.14.
The red arrow was the Tariff Tantrum last year. Again, you can understand when the S&P loses ten percent in a few days, how this would come down to 1.17. But now the S&P is barely off the high, and this is now at 1.22. Does this make sense?
I feel as though I should finish with a discussion on energy. This is another group I had liked and now think is overbought. I keep waiting for the DSI for oil or Brent or even gasoline to get over 90, and shockingly, the highest we have seen thus far is 86 for gasoline. Perhaps we will get an extreme reading heading into the weekend.
Related: Optimistic Market Players Fall into a Trap After Positive Day
