This Quiet Build in Fear Could Set Up the Market’s Next Big Move
No panic yet—but the steady rise in bearish sentiment, weakening breadth, and a climbing equity put/call ratio paint a telling picture. Here’s why it matters for traders watching for a bottom.
You've reached your free article limit
You've read 0 of 1 free Pro articles.
 US-STOCKS-MARKETS-OPEN
Over the last six weeks, I have spent a good deal of time chatting about sentiment. In early February, I thought we’d reached ‘giddy’ again (more on that later). And then as the software sector and growth stocks in general began their waterfall declines I harped almost daily about the options ratios.
Usually, I show you the 10-day moving average of the CBOE’s total equity put/call ratio. But today I would like to show you the 30-day moving average of the equity put/call ratio. To begin with, that low in October was the first sign we had of giddy sentiment (red arrow). But notice that the February giddiness did not show up in this chart. In October, it fell to .52 while in February it was only .57.
But now you might have to squint to see it, but it is at .64 which is where it was at the Tariff Tantrum last year.
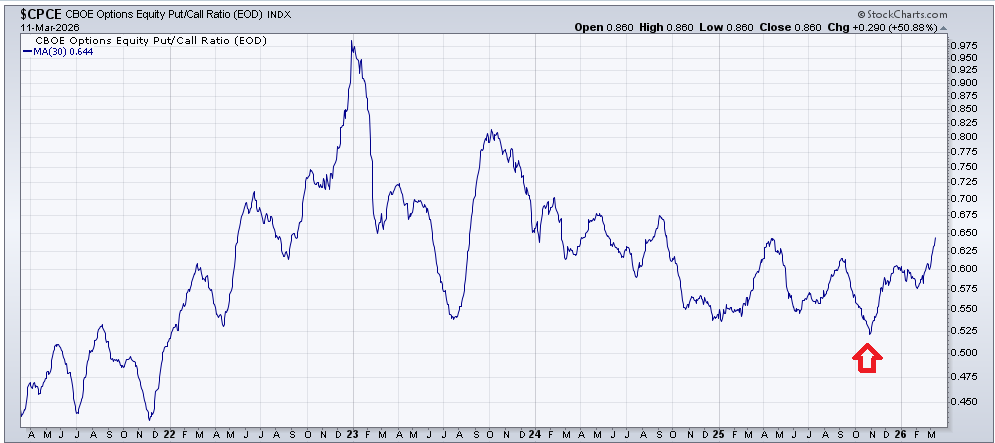
I suspect the reason is because this time around it has been building since October, whereas last year it was quick and the decline was over within a matter of days. Since we have not yet had a day where the equity put/call ratio skyrockets, it’s probably still out there. But look at the bright side: look how high it is already!
Despite all those options ratios showing put buying was, while not extreme, relentless, for the last six weeks, we did not see a lot of movement in the more slow-moving sentiment surveys. We did see the day traders at the American Association of Individual Investors clock in with barely more bears (34%) than bulls (33%) last week, which I noted was a step in the right direction.
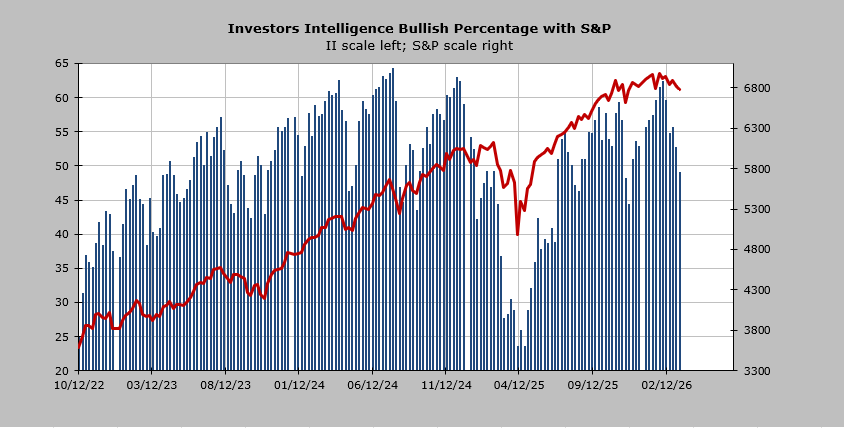
This week, we have yet another step in the right direction. The Investors’ Intelligence Bulls dropped off to 49%. Recall they were 63% in early February (giddy). In November, at the low, they were at 44%, but at least they are down 14 points from the peak.
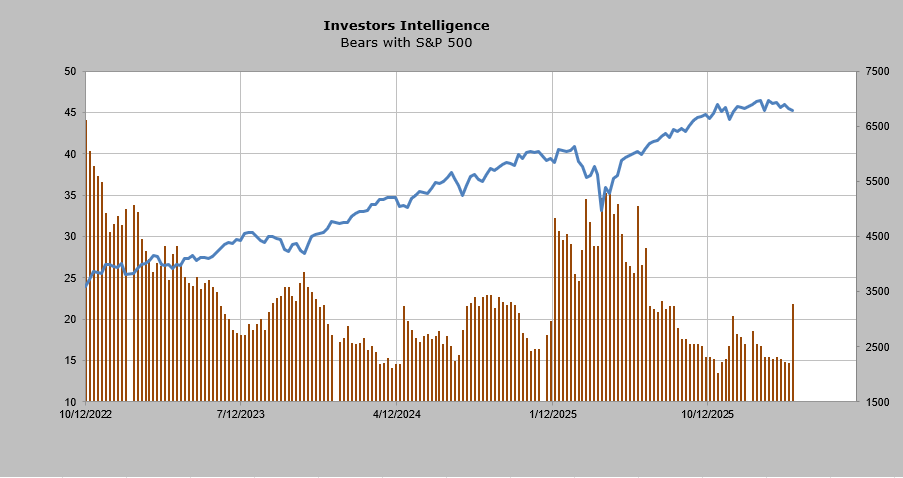
But it was the bears that really caught my eye. They jumped seven points! They are now at 21.8%, which is the highest reading since last summer. That is quite a surge.
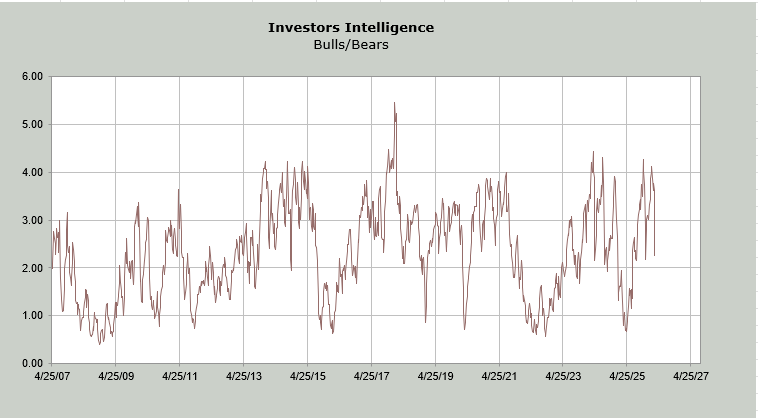
The bull/bear ratio was 4.13 the first week of February (giddy because it means there are four bears for every one bull). Last week we’d seen that come down to around 3.8. But this week? That’s down to 2.25. That is the same level it was at in November. Obviously, getting it under 1.0 (more bears than bulls) is ideal, but unless the S&P can break 6500, I doubt it gets there.
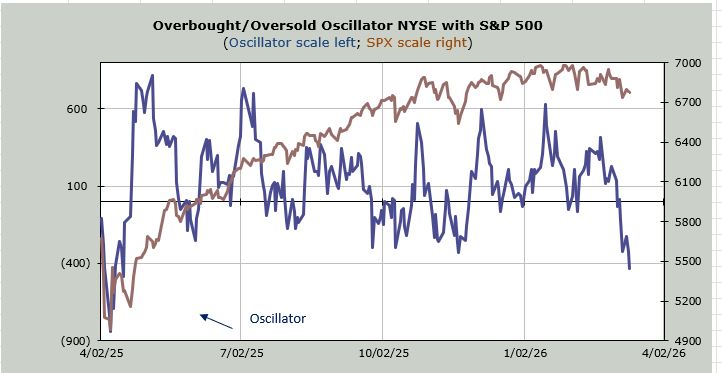
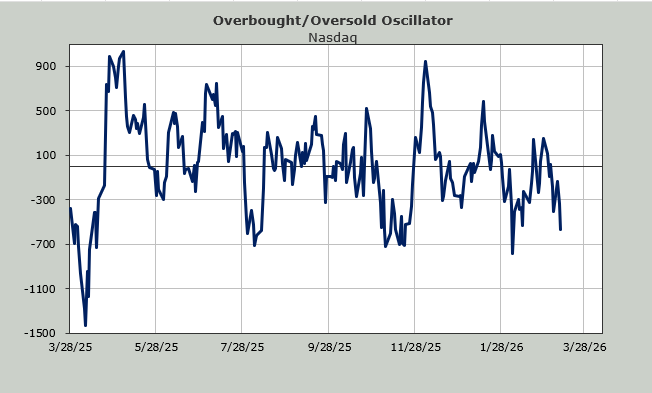
At least sentiment is finally showing some concern (no real fear yet). And the Overbought/Oversold Oscillator is pushing toward a short-term oversold condition. Breadth has been red for the last five trading days and six of the last seven. Each day we plug in a red breadth day is a day we get closer to a short-term oversold condition.
Related: Why the Next Market Move Could Be Sizable — And How to Be Ready for It
