This One Chart Can Tell Us What Stage of the Bull Market We're In
And it isn't pretty. But it's the most exciting chart you'll see all day.
You've reached your free article limit
You've read 0 of 1 free Pro articles.
I have seen arguments that, typically, by this stage of a bull market, we should see companies IPO’ing all over the place. I honestly do not recall a gazillion IPOs in 2006-2007, but I do remember it was a daily occurrence in the late 1990s.
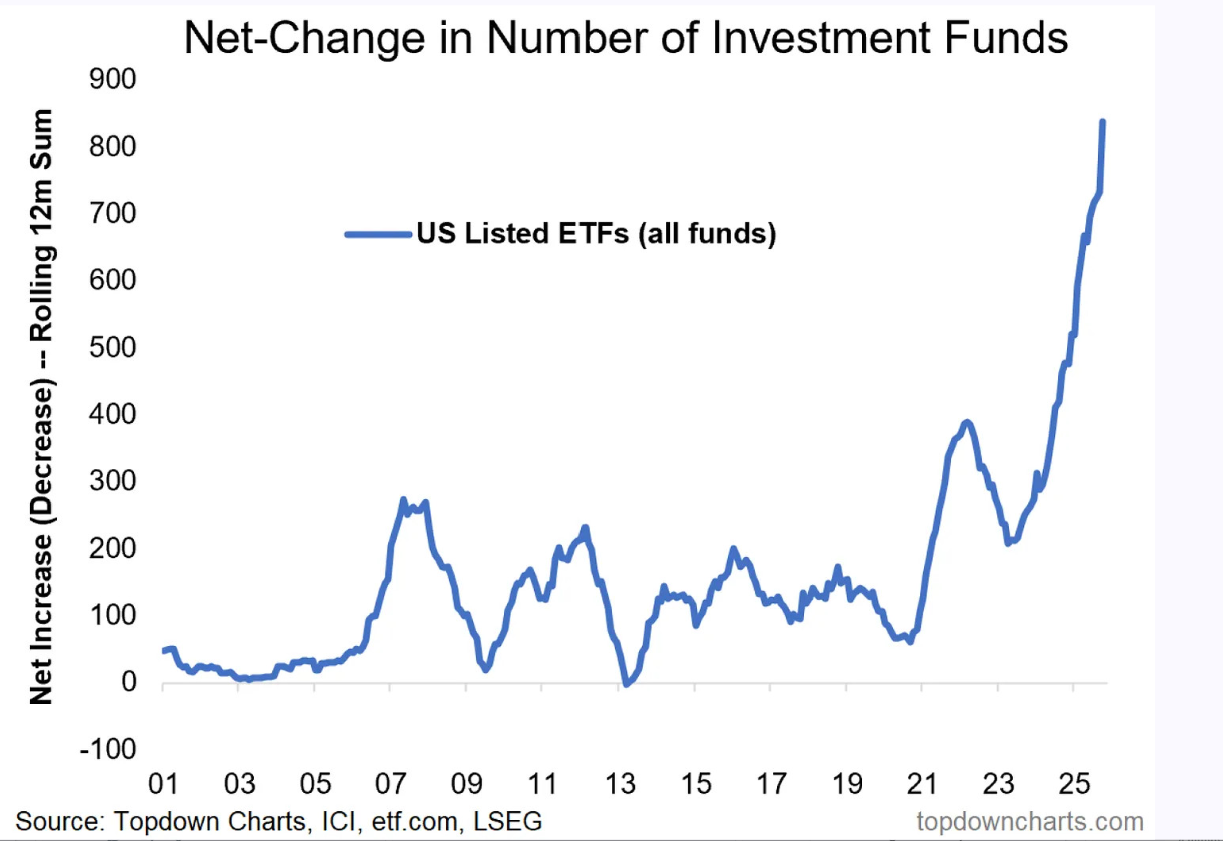
In late 2020 and early 2021, it wasn’t IPOs either but rather SPACs. So when I saw this chart of the explosion in ETFs created since 2023 (courtesy of Topdown Charts), I just had to share it with you.
I realize ETF creation is not the same as SPACs nor IPOs, but consider that a good majority of these ETFs have the same ten stocks in them. Then I look at the chart, and I see that it turns out we may not have had an IPO boom in 2007, but we surely had an ETF boom. Look at that growth in ETFs in 2006-07.
And that was probably the most exciting chart I saw during Tuesday’s market. Sure, I said I thought we’d rally again, but that was one lethargic rally. Volume has barely picked up from Thanksgiving week.
And after enjoying a great week for the 493, they have taken a back seat this week. Why yes, NVIDIA has rallied the last two days.
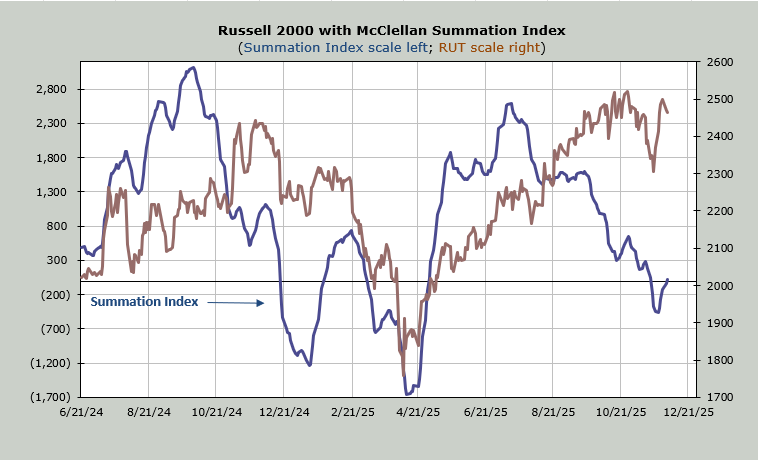
Either way, the McClellan Summation Index has not yet turned back down. It would require a net differential of -1100 advancers minus decliners on the NYSE to halt the rise and more to turn it back down.
The number of stocks making new highs remains well below the peak readings from a few months ago, and while the number of new lows hasn’t expanded greatly, I’ve got my eyes on Nasdaq’s reading, which scooted up to 135 on Tuesday. That is the highest reading in a week.
After fussing nonstop about Bitcoin on Monday, with every segment on financial television telling us why it was down, I did not see one mention of it on Tuesday. Probably because it rallied.
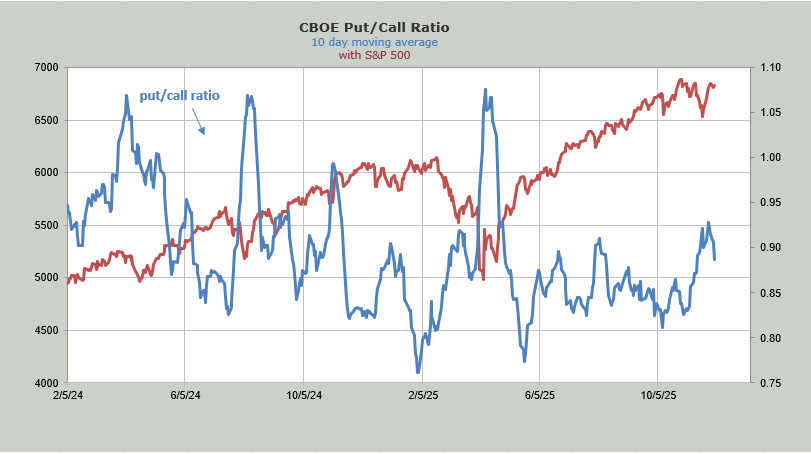
In any event, we’ll get to see if the more intermediate-term sentiment surveys changed this week, beginning on Wednesday. But I can tell you that the put/call ratio, after jumping back to .95 on Monday, sunk back again on Tuesday with a reading of .78. That means the ten day moving average which had gotten to .93 (the highest since April) last week is now back under .90. A few more low readings and this will be back near .85 as we get overbought at the end of the week.
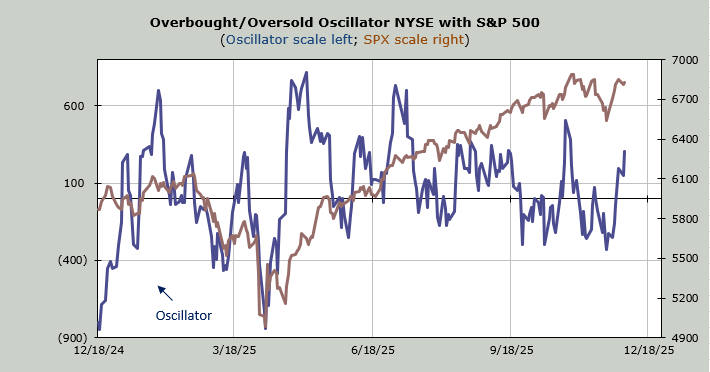
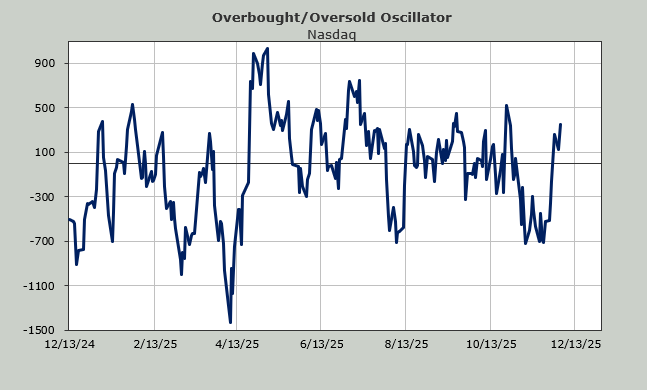
My notes do continue to point to an overbought reading near the end of this week. The Russell 2000 Momentum Indicator gets overbought Wednesday. Nasdaq’s Momentum Indicator gets overbought on Thursday, and my own Overbought/Oversold Oscillator gets overbought on Friday.
It’s hard to pick the exact day, but that’s the general time frame. And if that put/call ratio falls anymore, we’ll have sentiment in the right place. Finally, the Daily Sentiment Index (DSI) for the VIX is back at 20, so if we do rally much more, that will be a teenager once again.